How do we measure latency
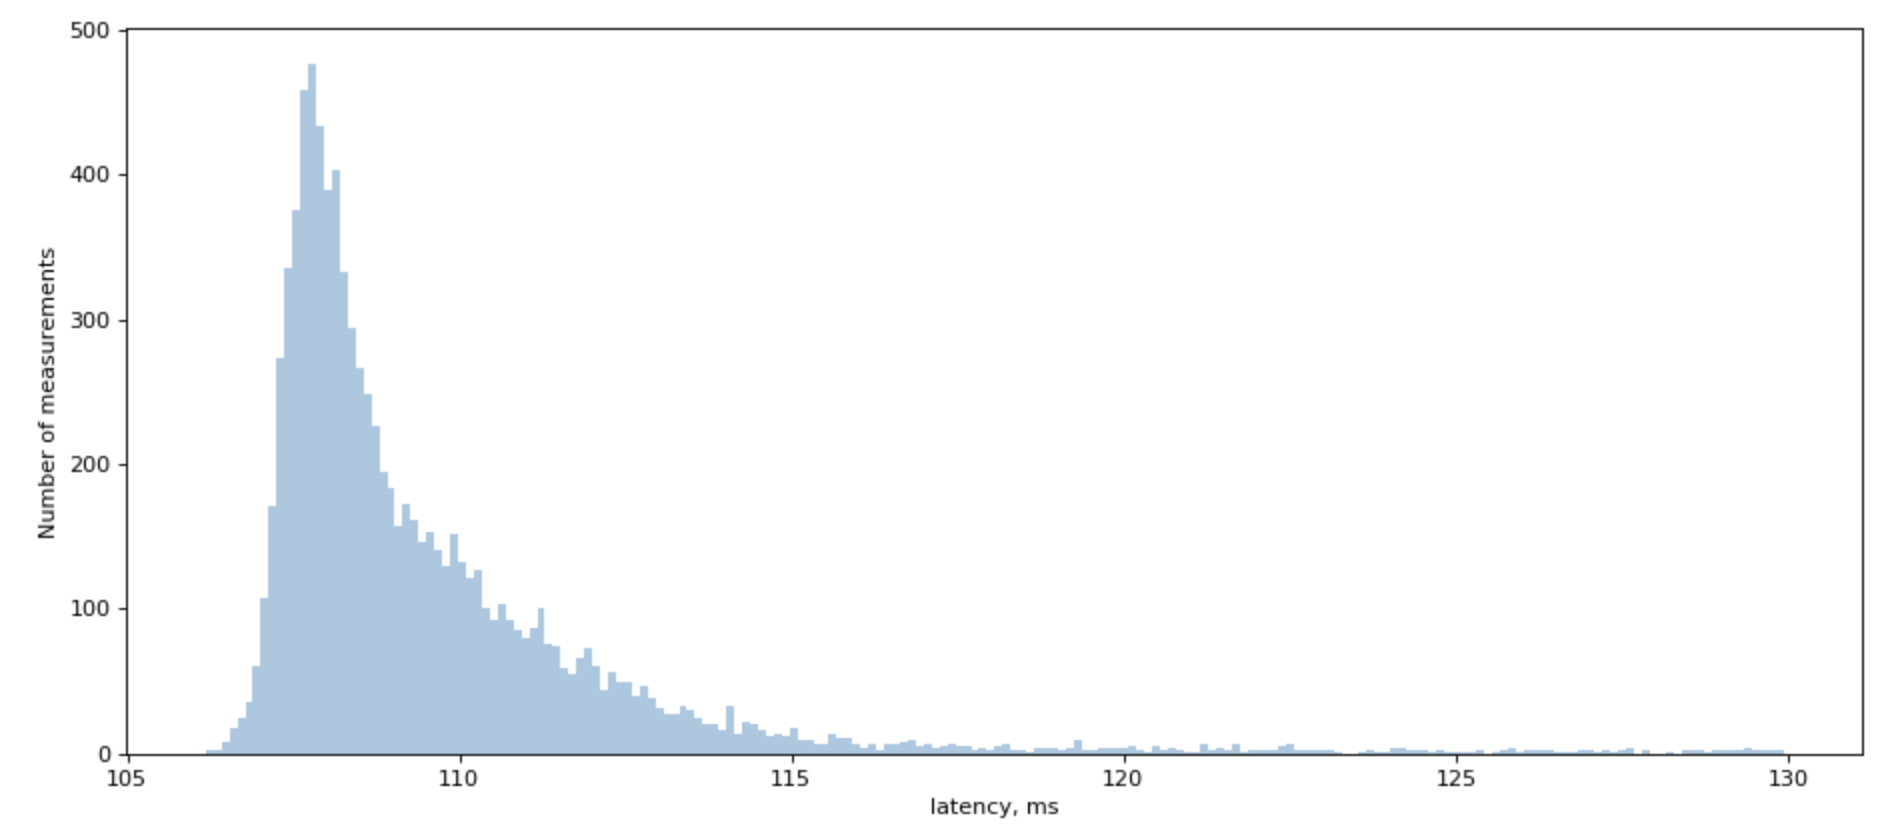
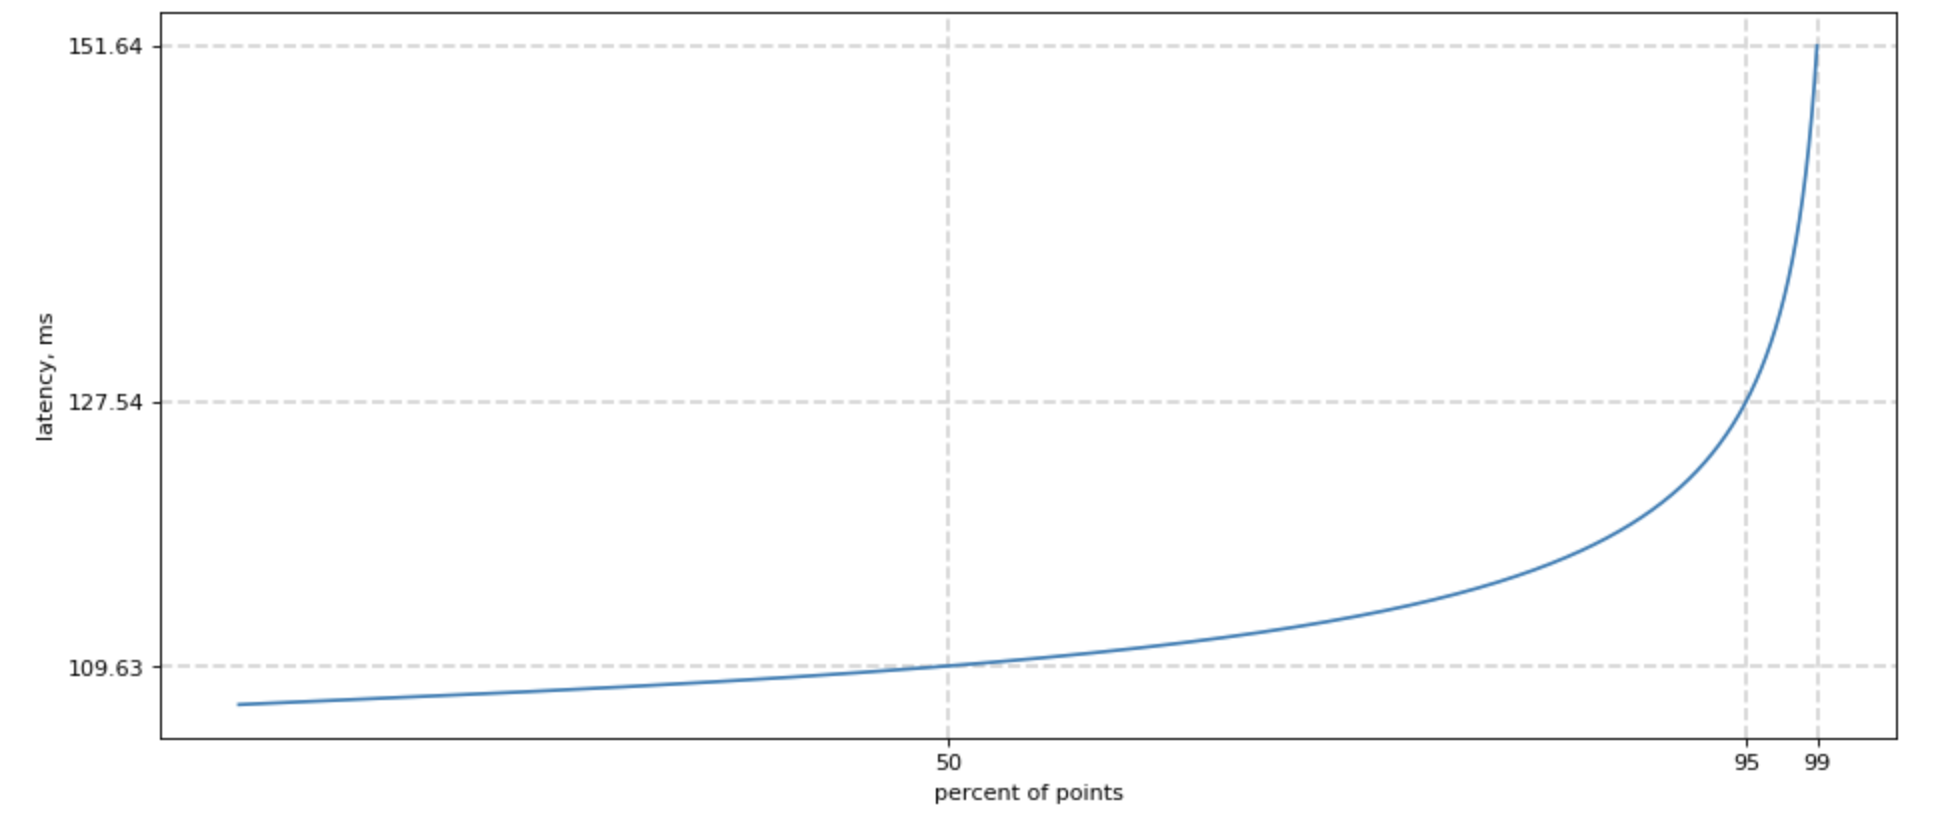
When we try to measure a latency to backend, including Redis, we would see a chart similar to this one:

We often simplify things, saying that it’s a “lognormal” distribution, but if you try to fit lognoram distribution, you will find that real-world distribution has a very unplesant tail that doesn’t really want to be fitted.
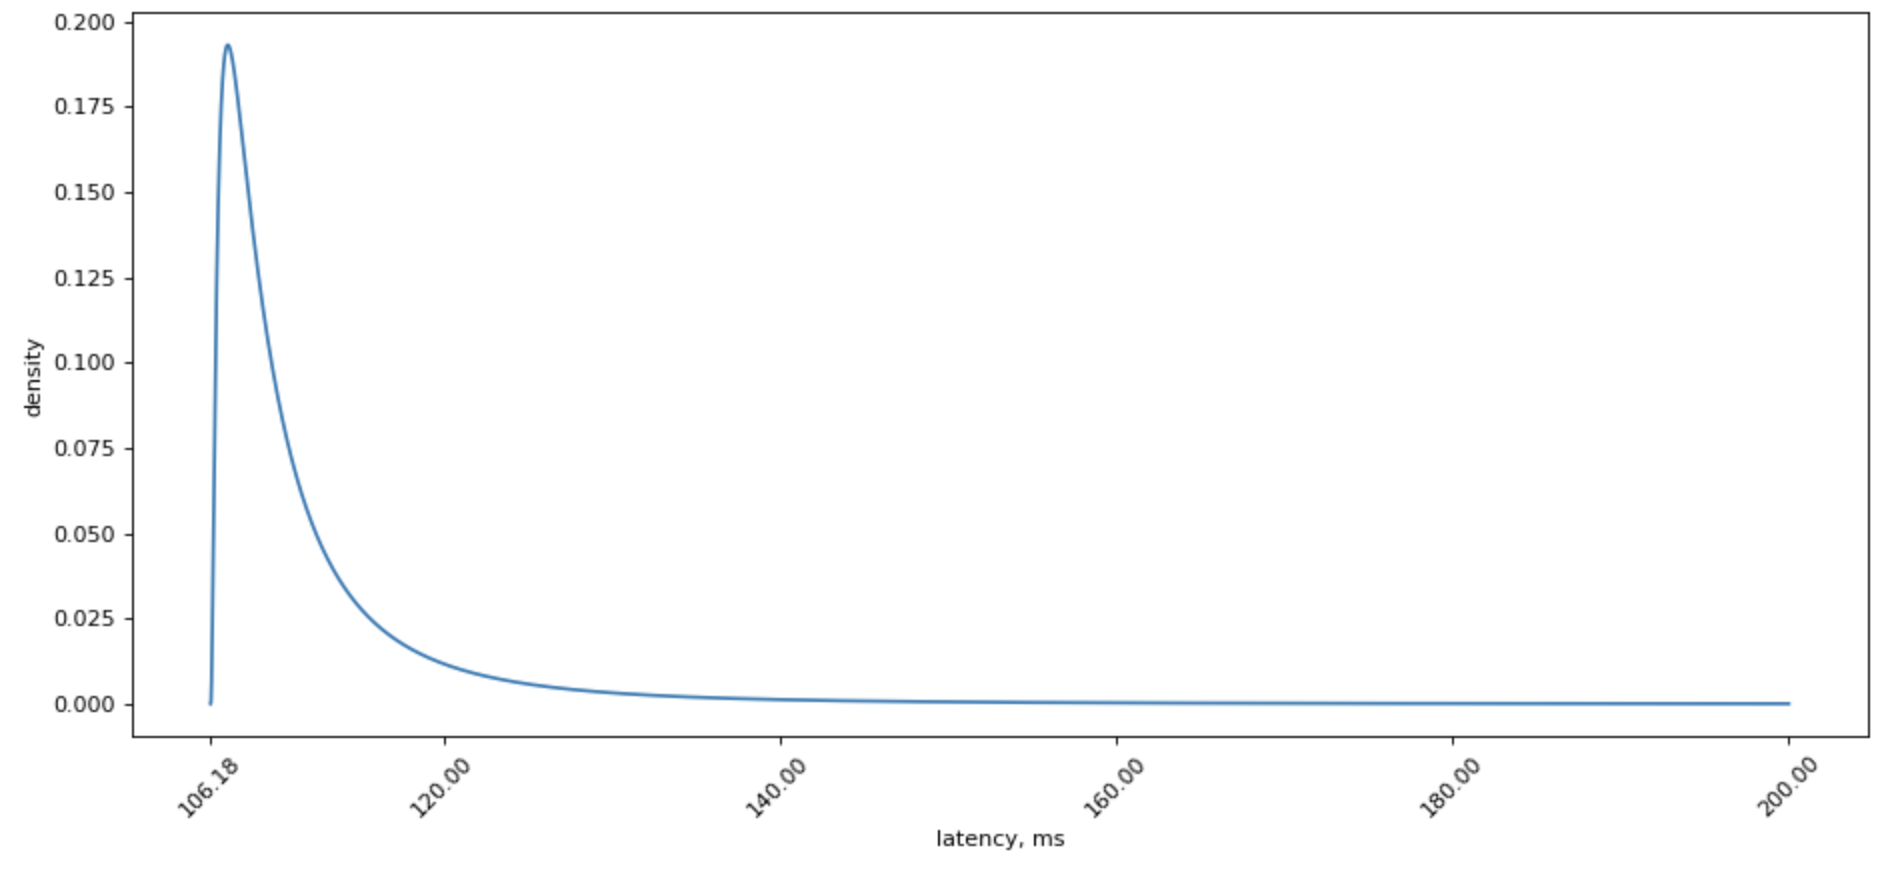
However, lognormal distribution is sure much prettier to look at:

Since we started speaking of tails, how do we measure one?
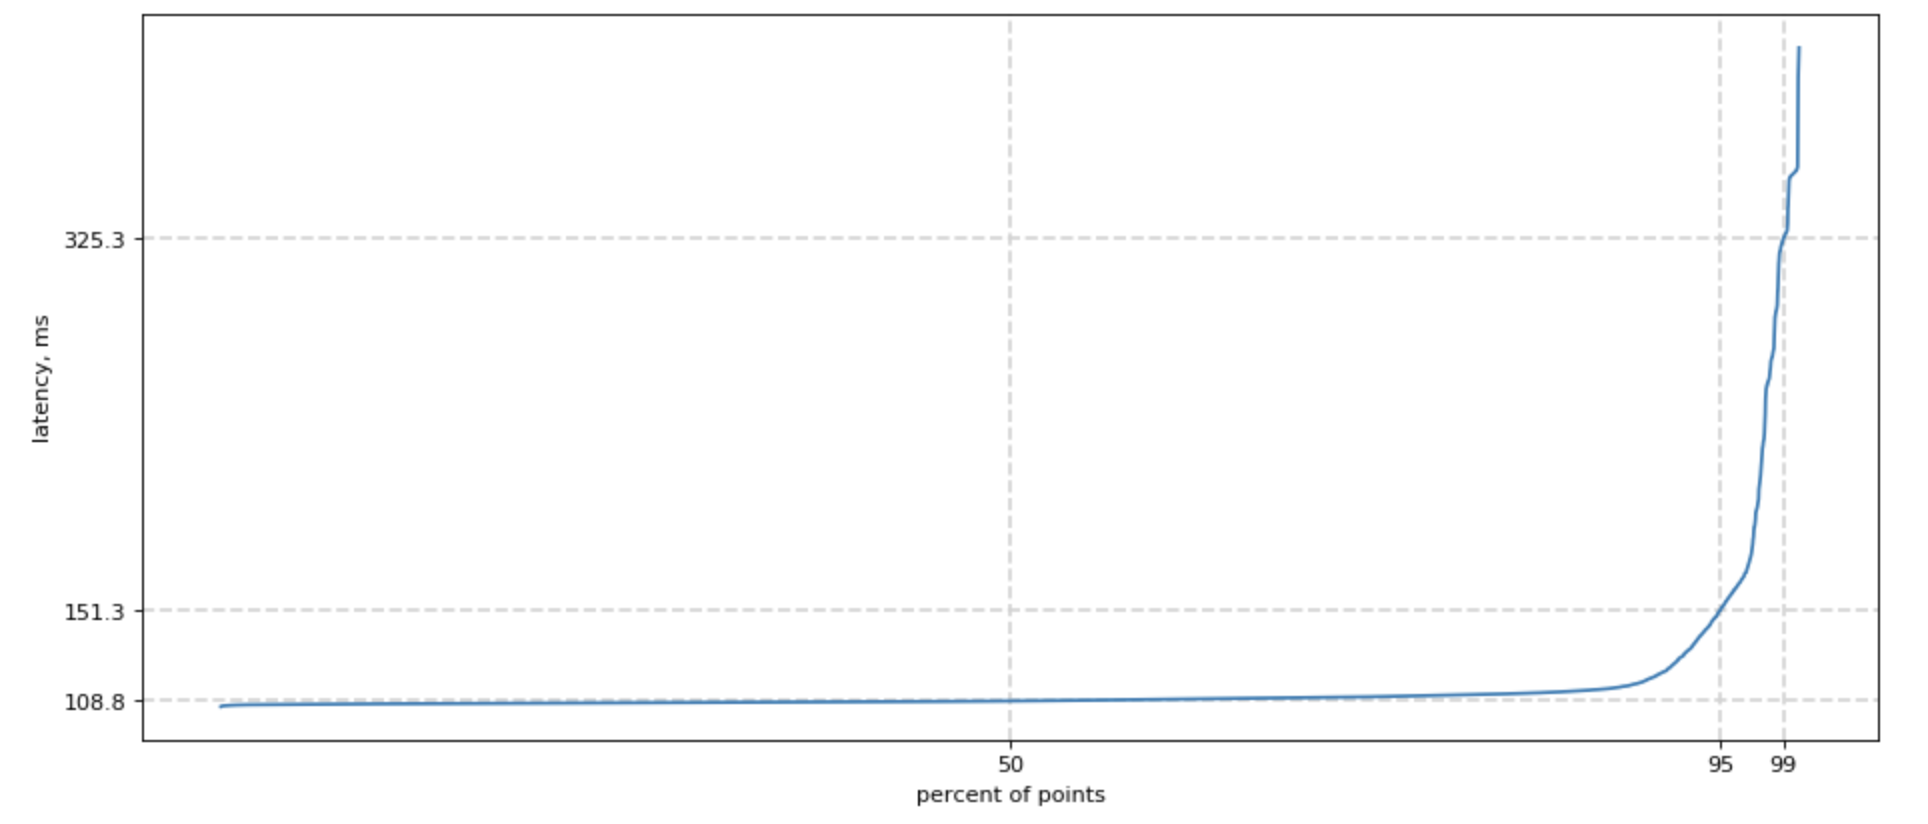
Easy! We can sort all our measurements, count 50% lowest latencies, and ask what is the highest latency for this group? We would also want this number of 50, 95, and 99 percentile, and sometimes 99.9. For shortness, we call it p50, p95, p99.

Poorly fitted, but much prettier chart for lognormal distribution looks like this:

Overall p99 latency
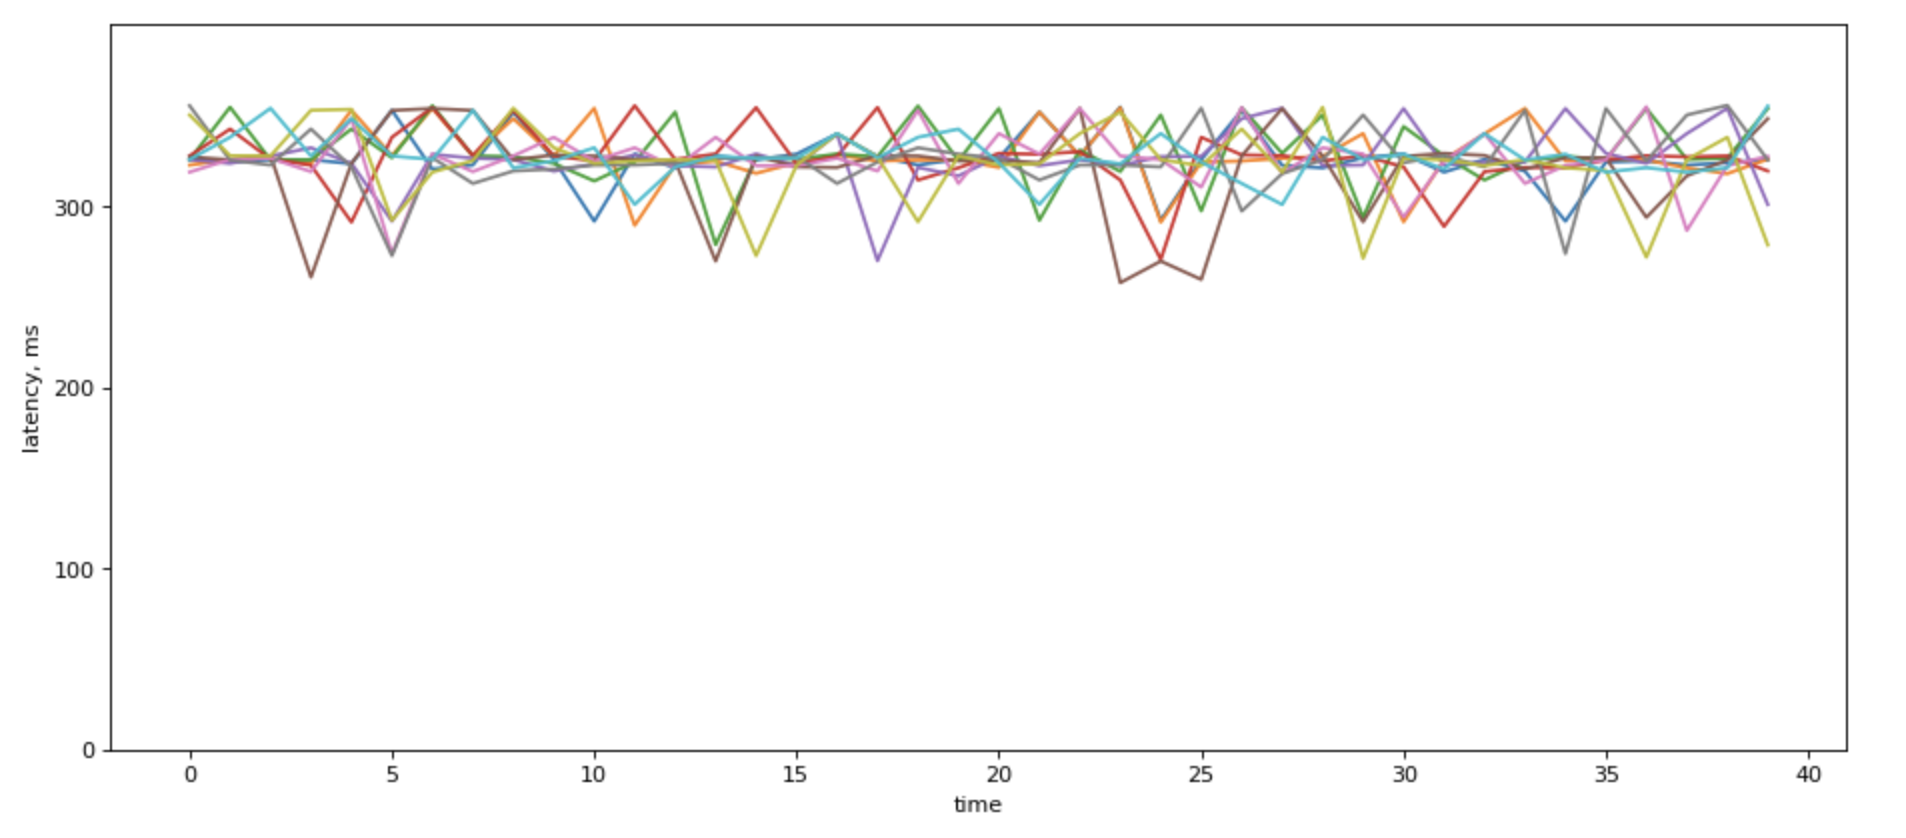
When you show p99 over time for different backends it would most likely look something like this, if the servers have different loads:

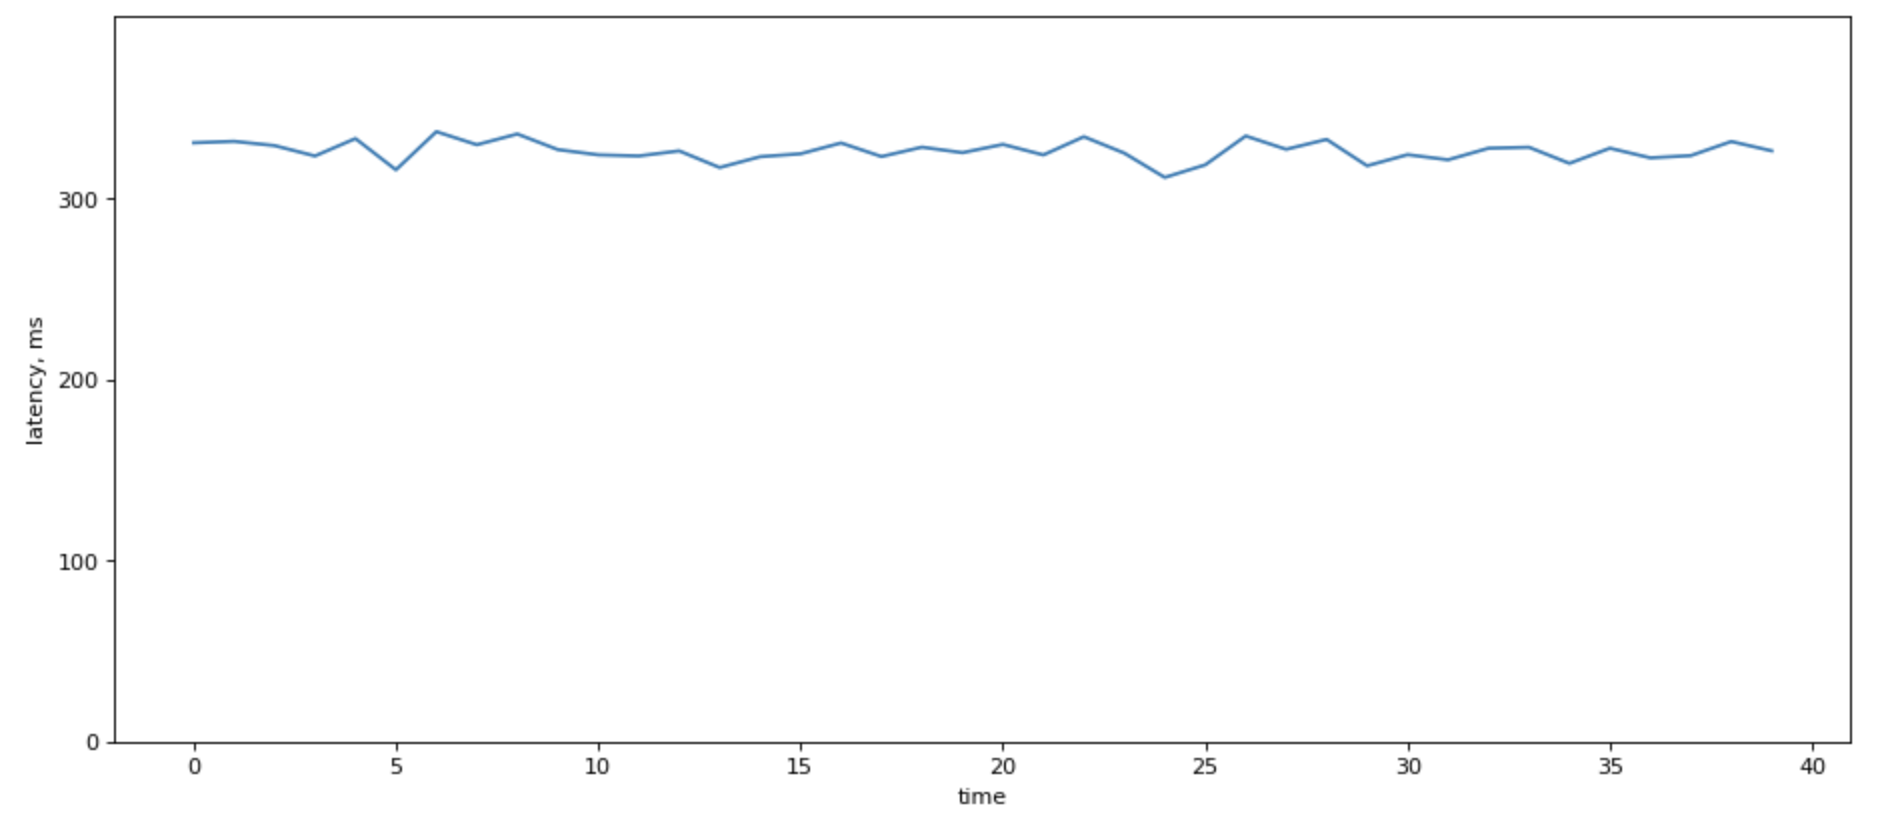
When there are a lot of lines in there, fight the urge to average over p99. It sure looks prettie:

Howeer, it destroys information about load balancing among your servers.
One of the “right ways” to calculate system’s p99 latency is by using a sample of latencies across the system. But this can be burdensome.
May be the way is not to calculate it at all.
A good reason not to use average is to think about a couple of situations where averaging will give a very wrong results:
High p99 in part of the system
| Node |
Latency |
RPS |
| Node 1 |
100 ms |
1000 |
| Node 2 |
200 ms |
1000 |
If you sort their latencies, most likely, second node’s latencies would be so far to right compared to the first one, and the overall latency would be dominated by the second node. So the “true” p99 would be 200ms, but the average is just 150ms. Not great.
Unbalanced load
A second case, if you have unbalanced load profile, where one (some) of your nodes handle a higher load. That easily can happen in heterogeneous system with baremetal servers.
Consider two nodes from our distribution
| Node |
Latency |
RPS |
| Node 1 |
151 ms |
1000 |
| Node 2 |
78 ms |
10000 |
The average of that is (151+78)/2 = 114.5. But in reality, that can be just 80 ms, because Node 1 with high RPS would “dominate” the distriubiton.
Latency: from linear growth to exponential decay with number of backends
We’ve already discussed how do we measure latency and that we use p95, p99, and sometimes p999.
Let’s look at what happens when we have multiple backends. For simplicity, I’m going to use the same latency profile for all backends.
And you can think of these backends as redises.
Sequential access is not great.
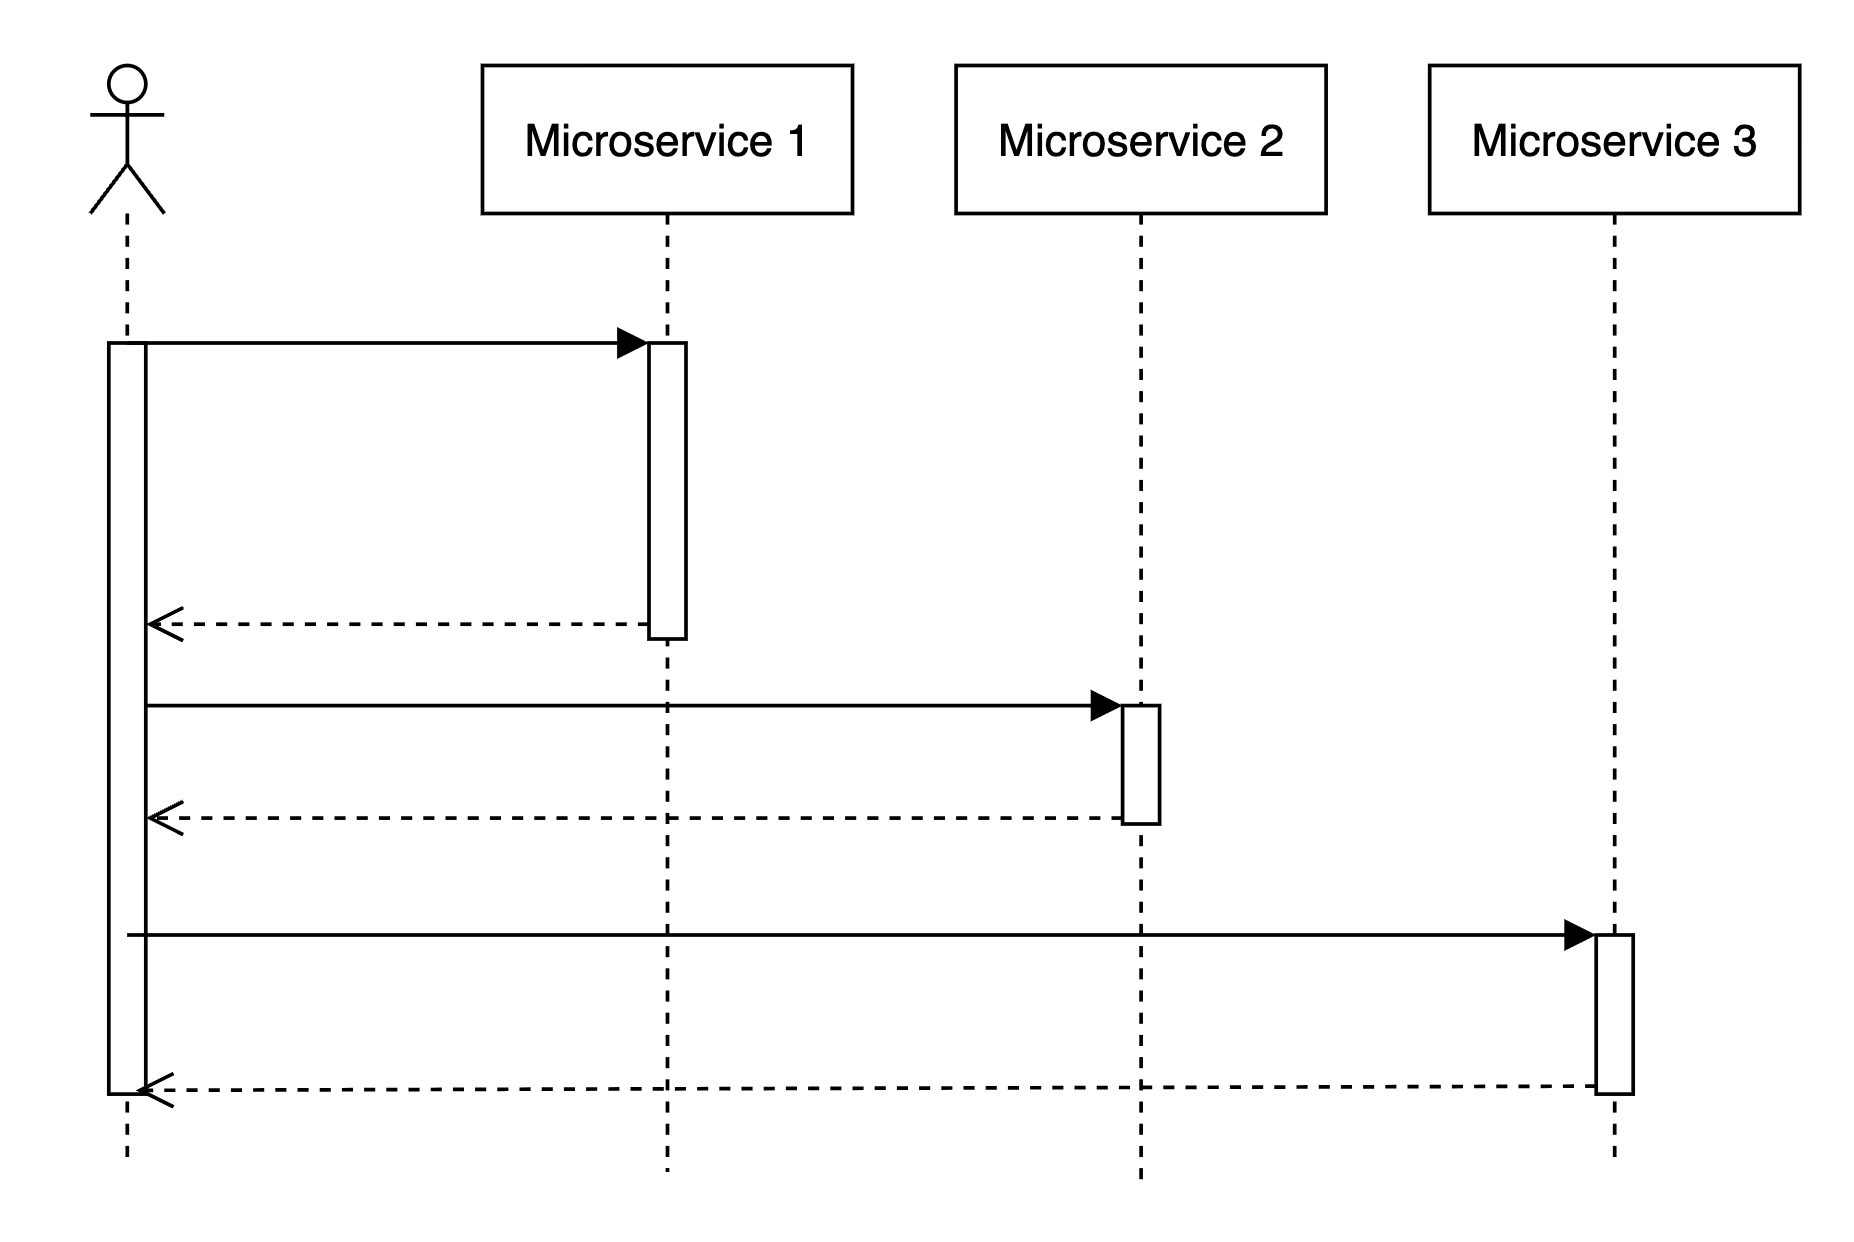
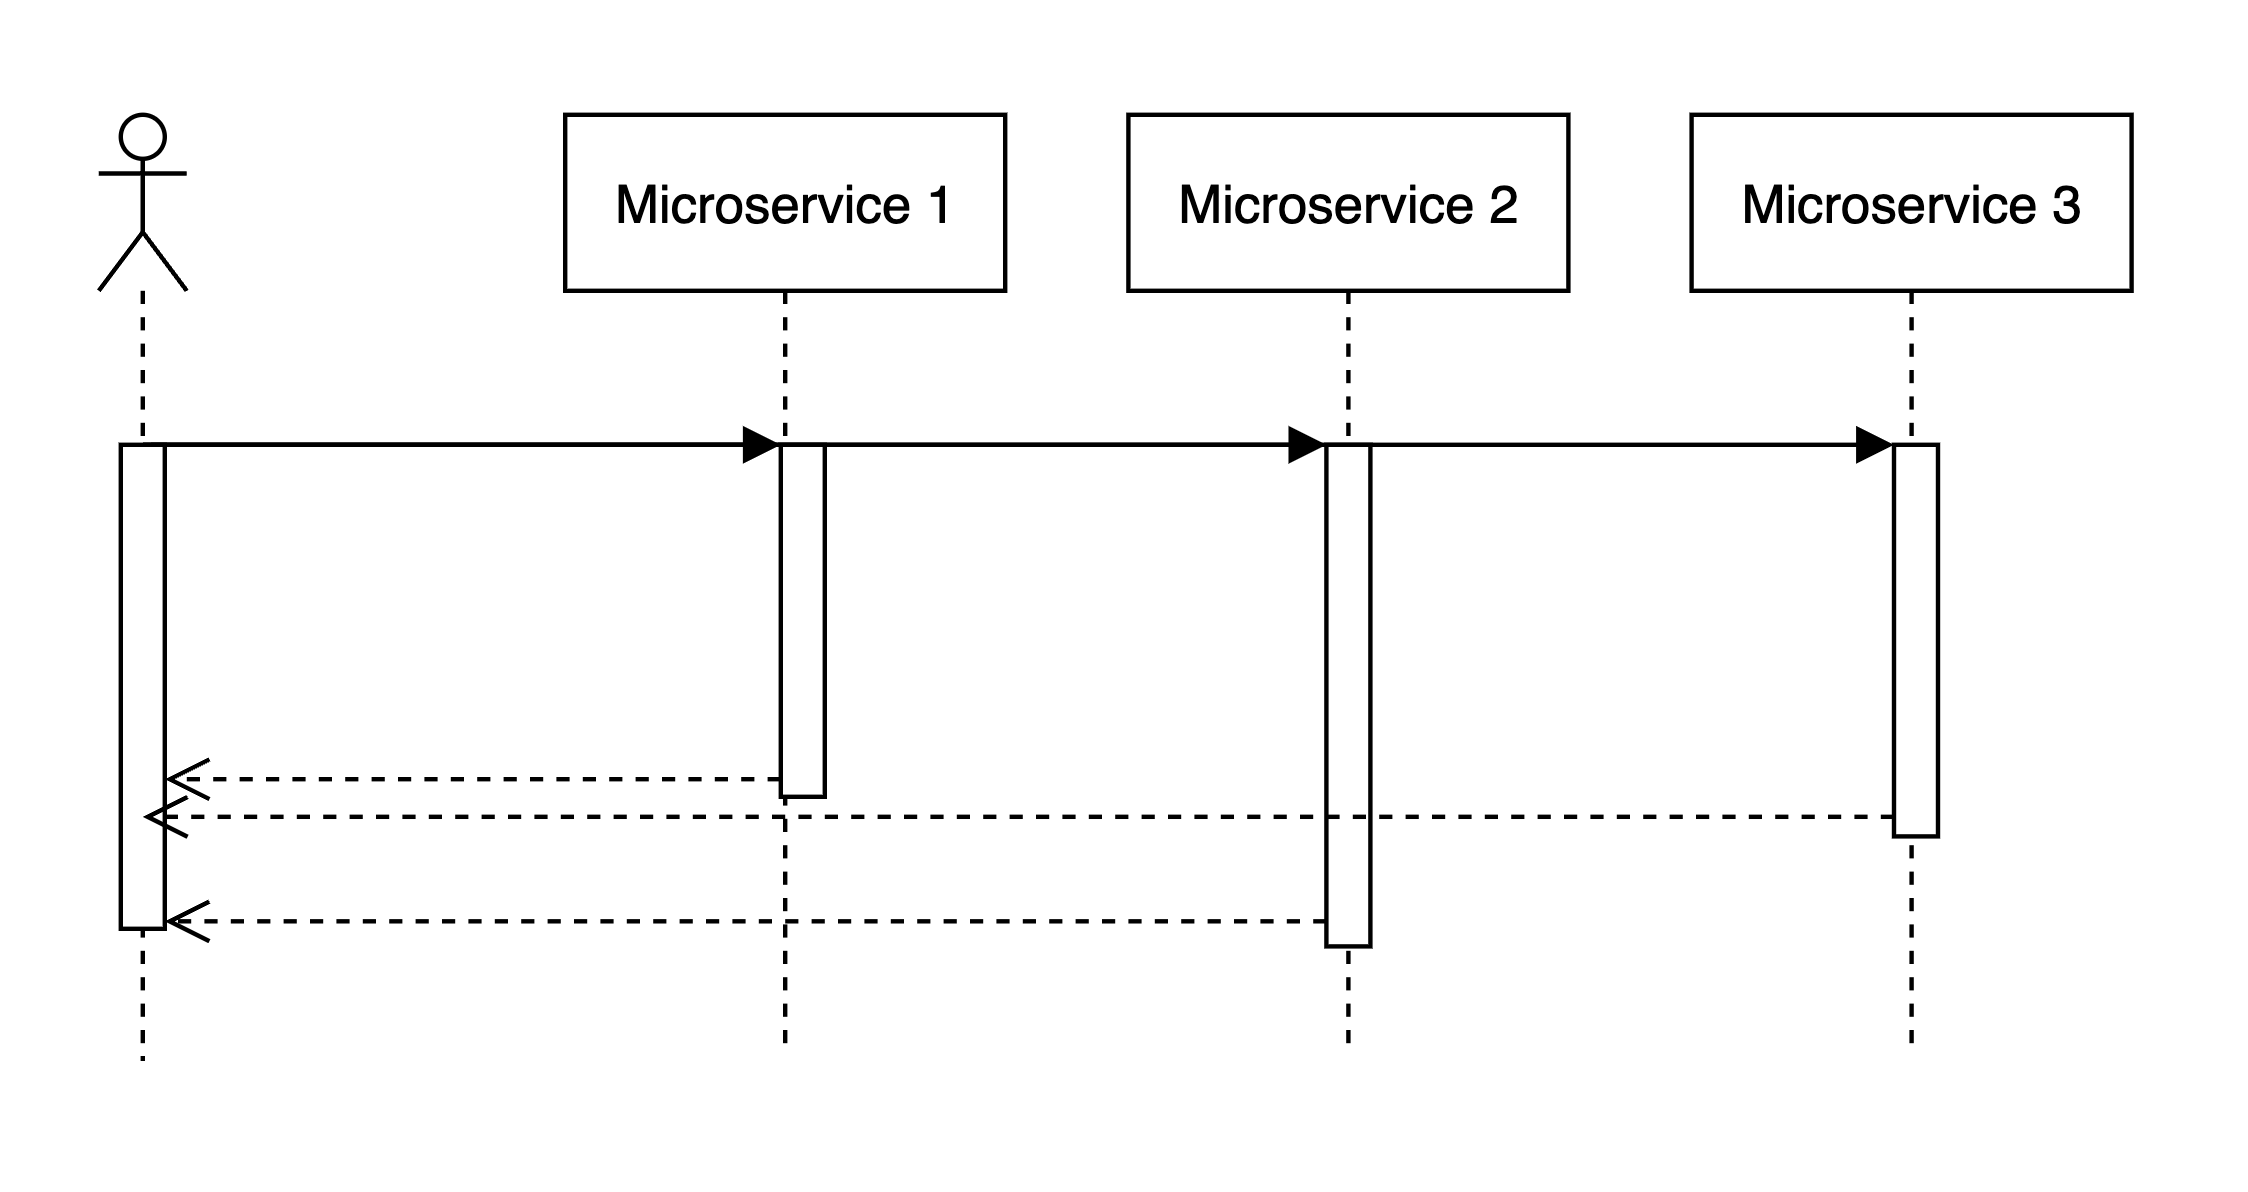
Imagine that when request comes we handle it like this:
- Some logic
- Access microservice
- Some extra logic
…
N. response

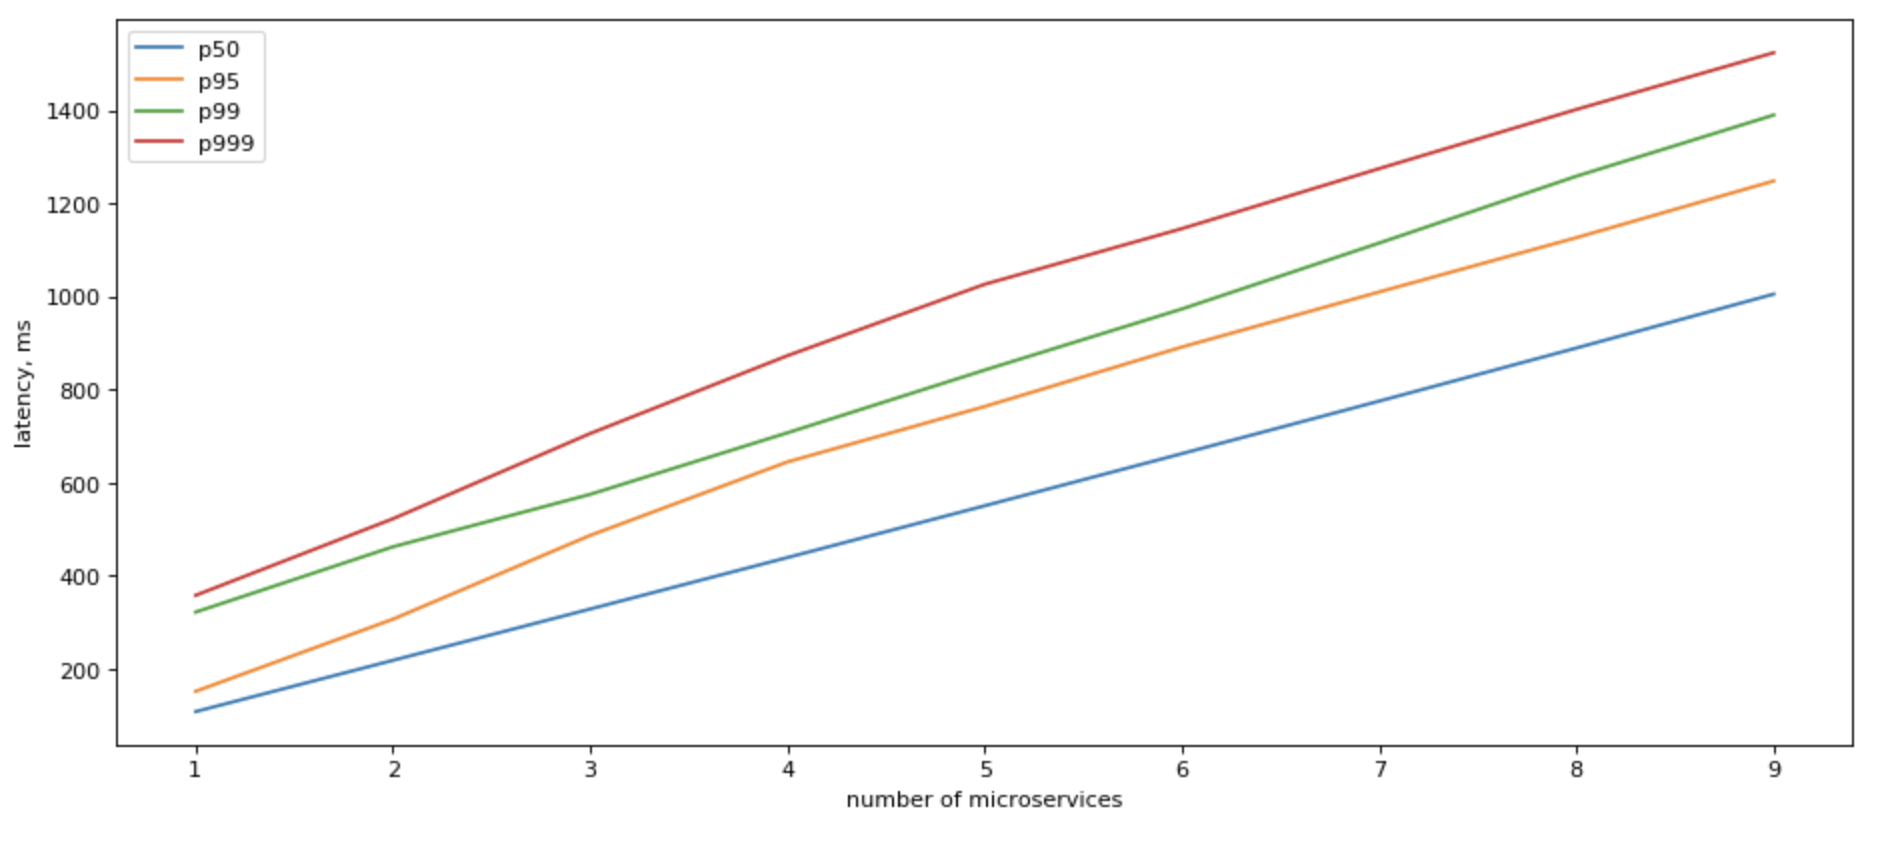
In this case, tail latencies will stack up in an expected linear manner.

Can we do anything about it?
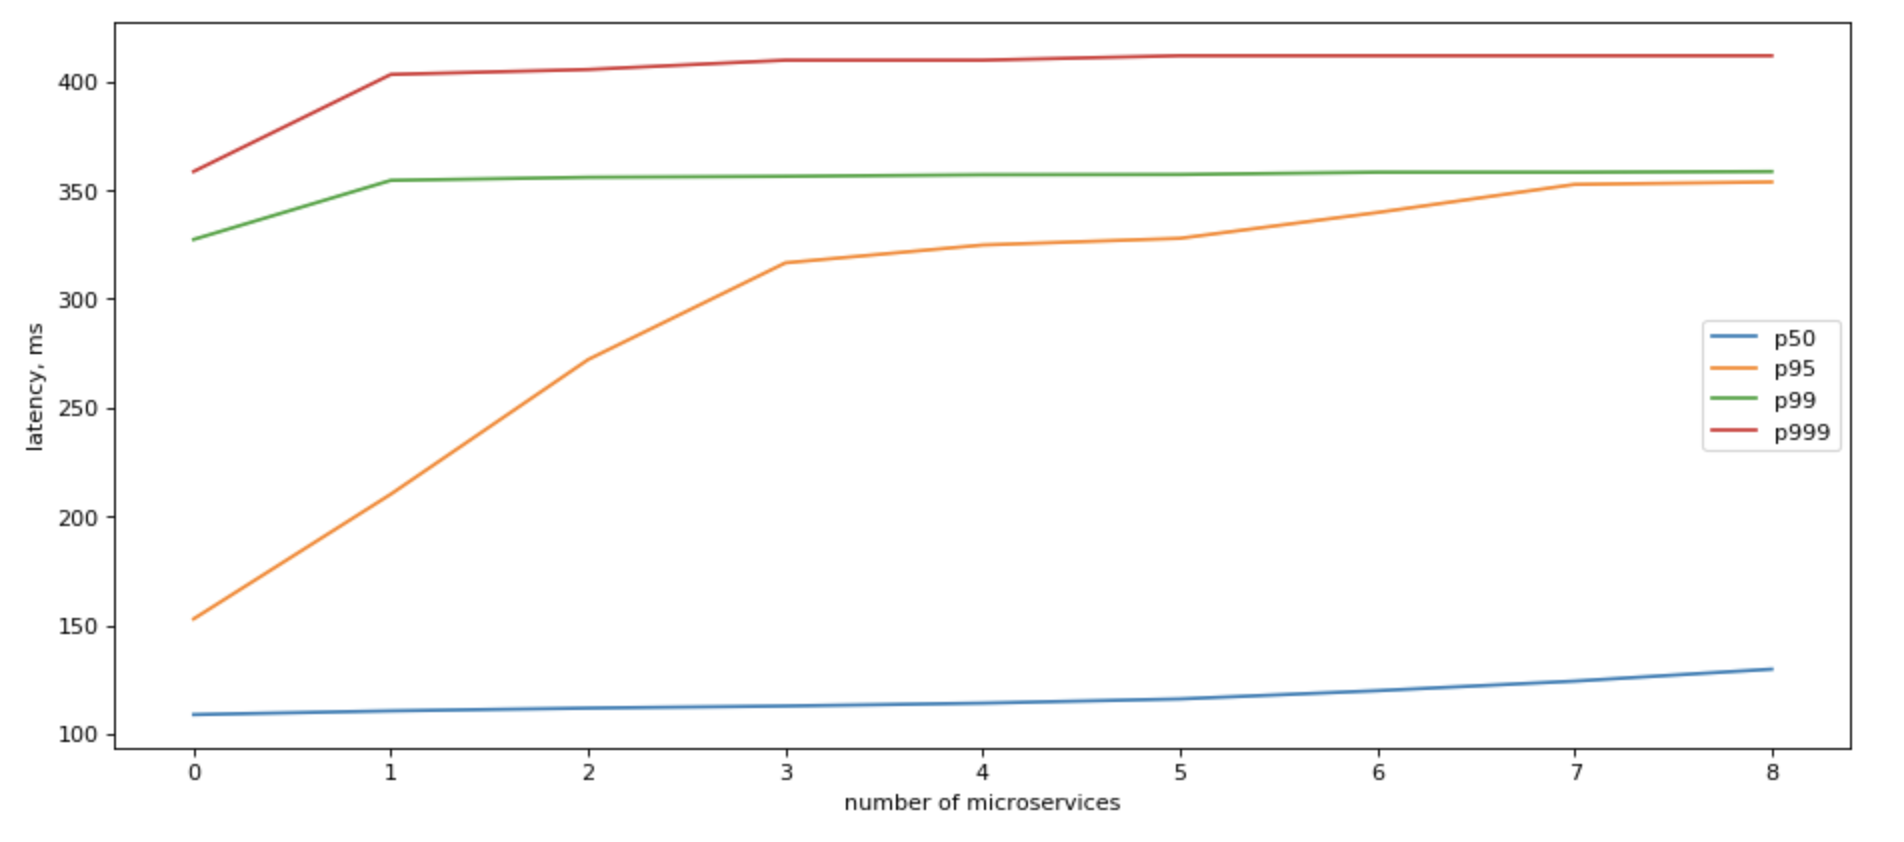
Yes, we can! If we can refactor our app to make parallel calls to all downstream microservices in parallel, our IO latency would be capped by the slowest response of a single service!

In that case, tail latency would grow roughly logarithmically with the number of backends:

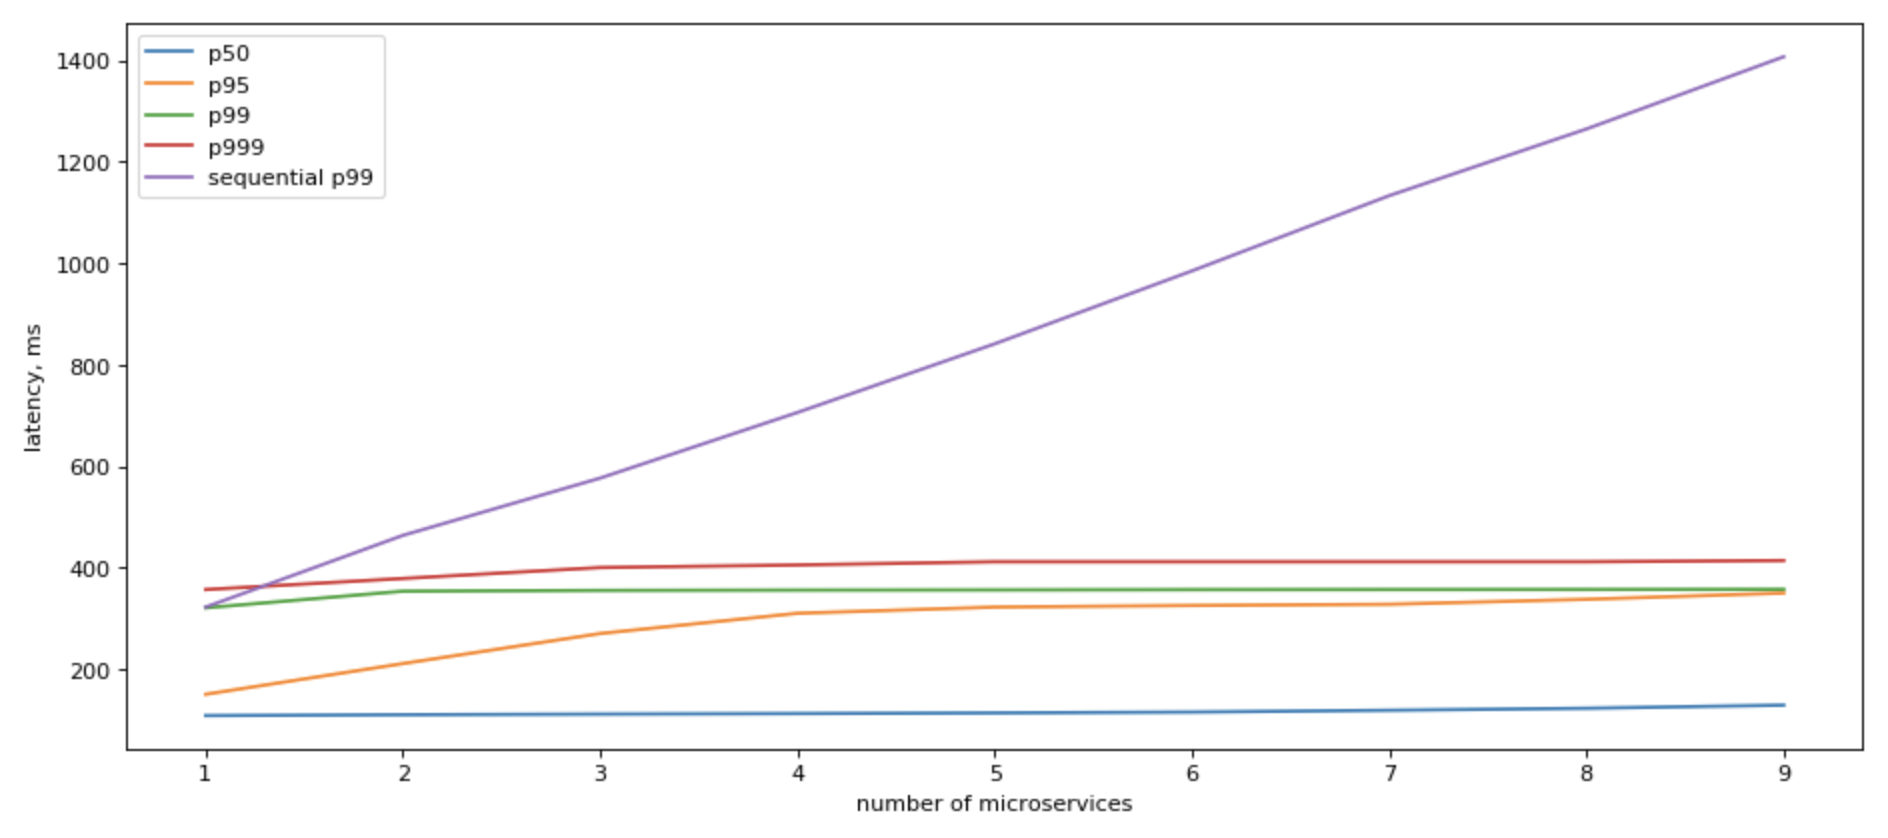
If we look at what sequential IO gives us, the picture becomes clearer:

It still slower than having just 1 microservice to access, but it’s a very significant positive change.
Can we do something more about it?
Parallel microservices access
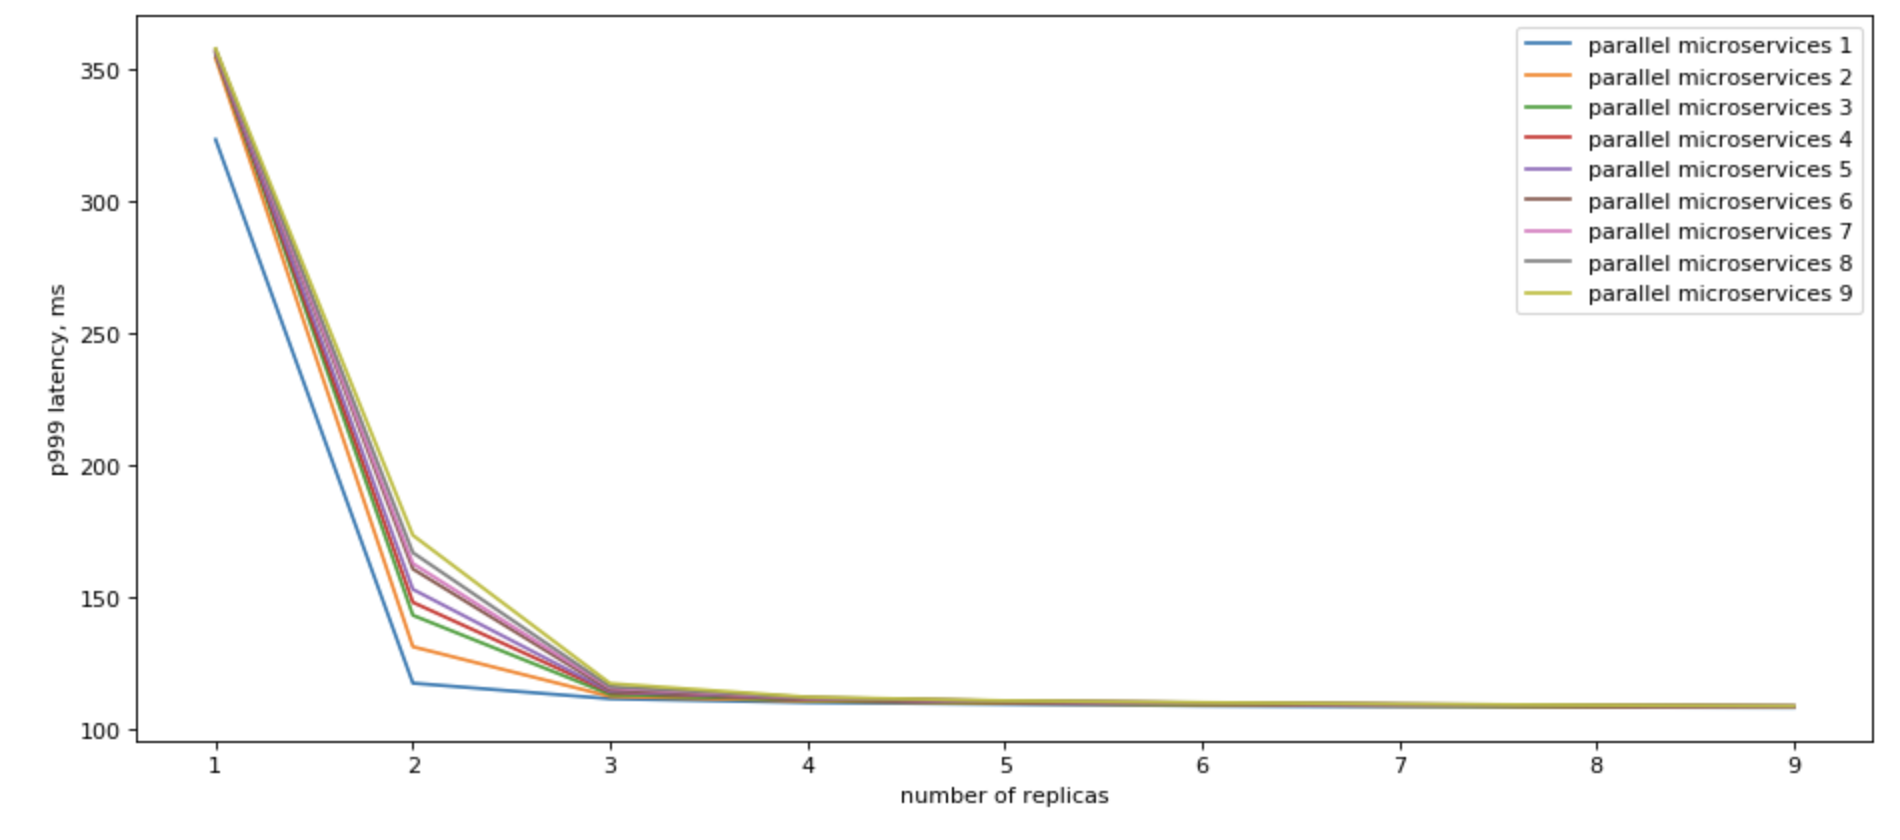
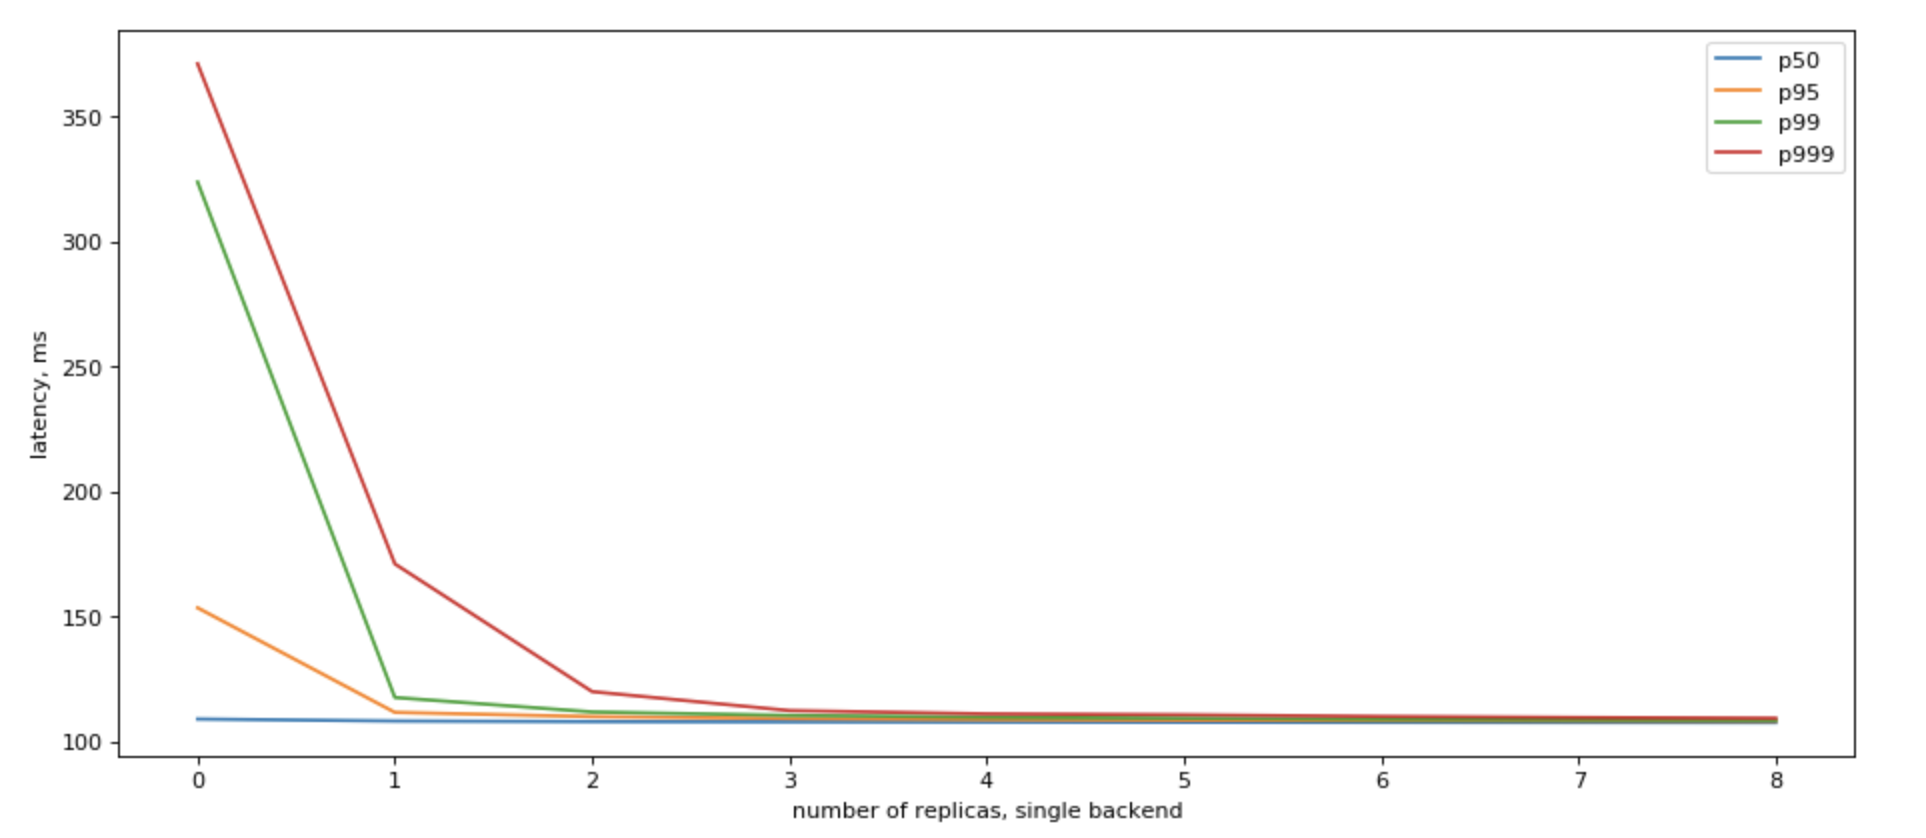
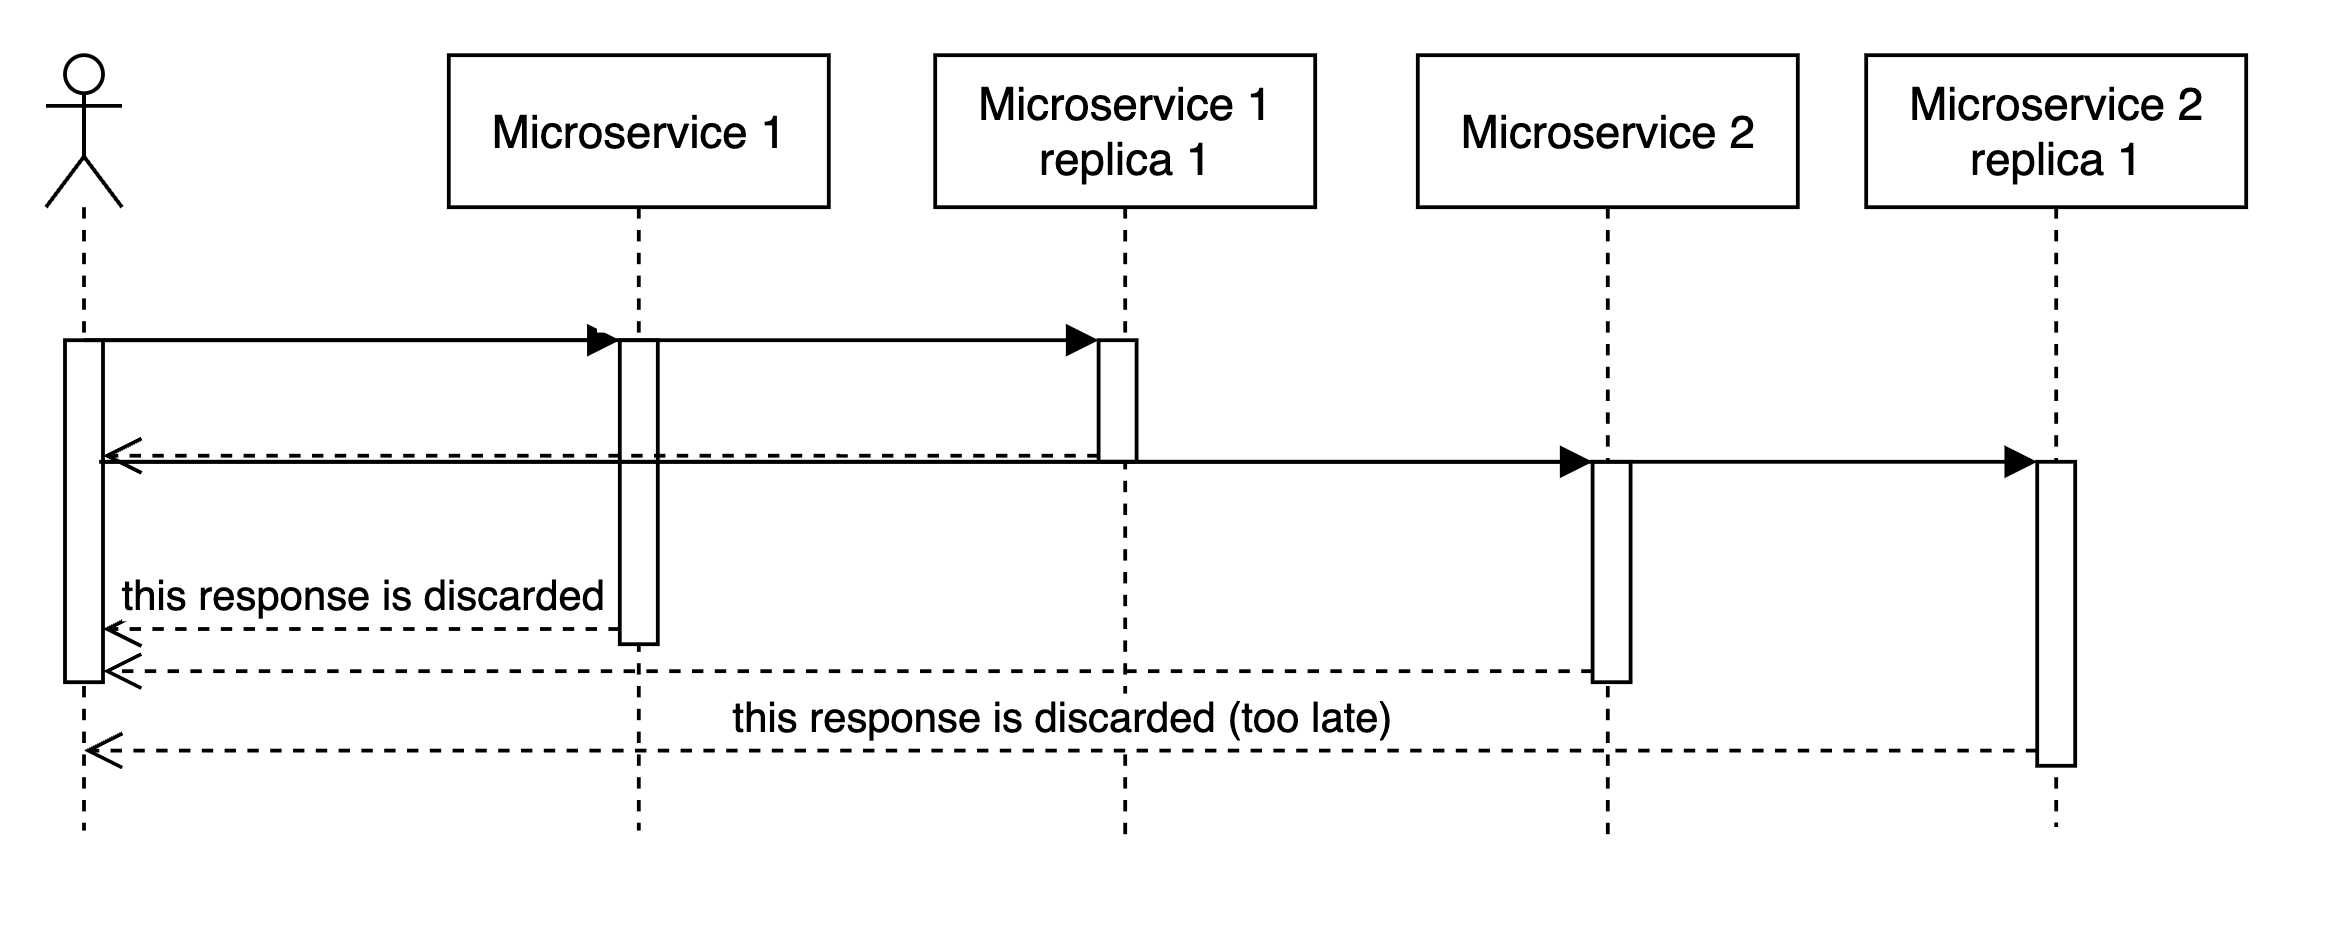
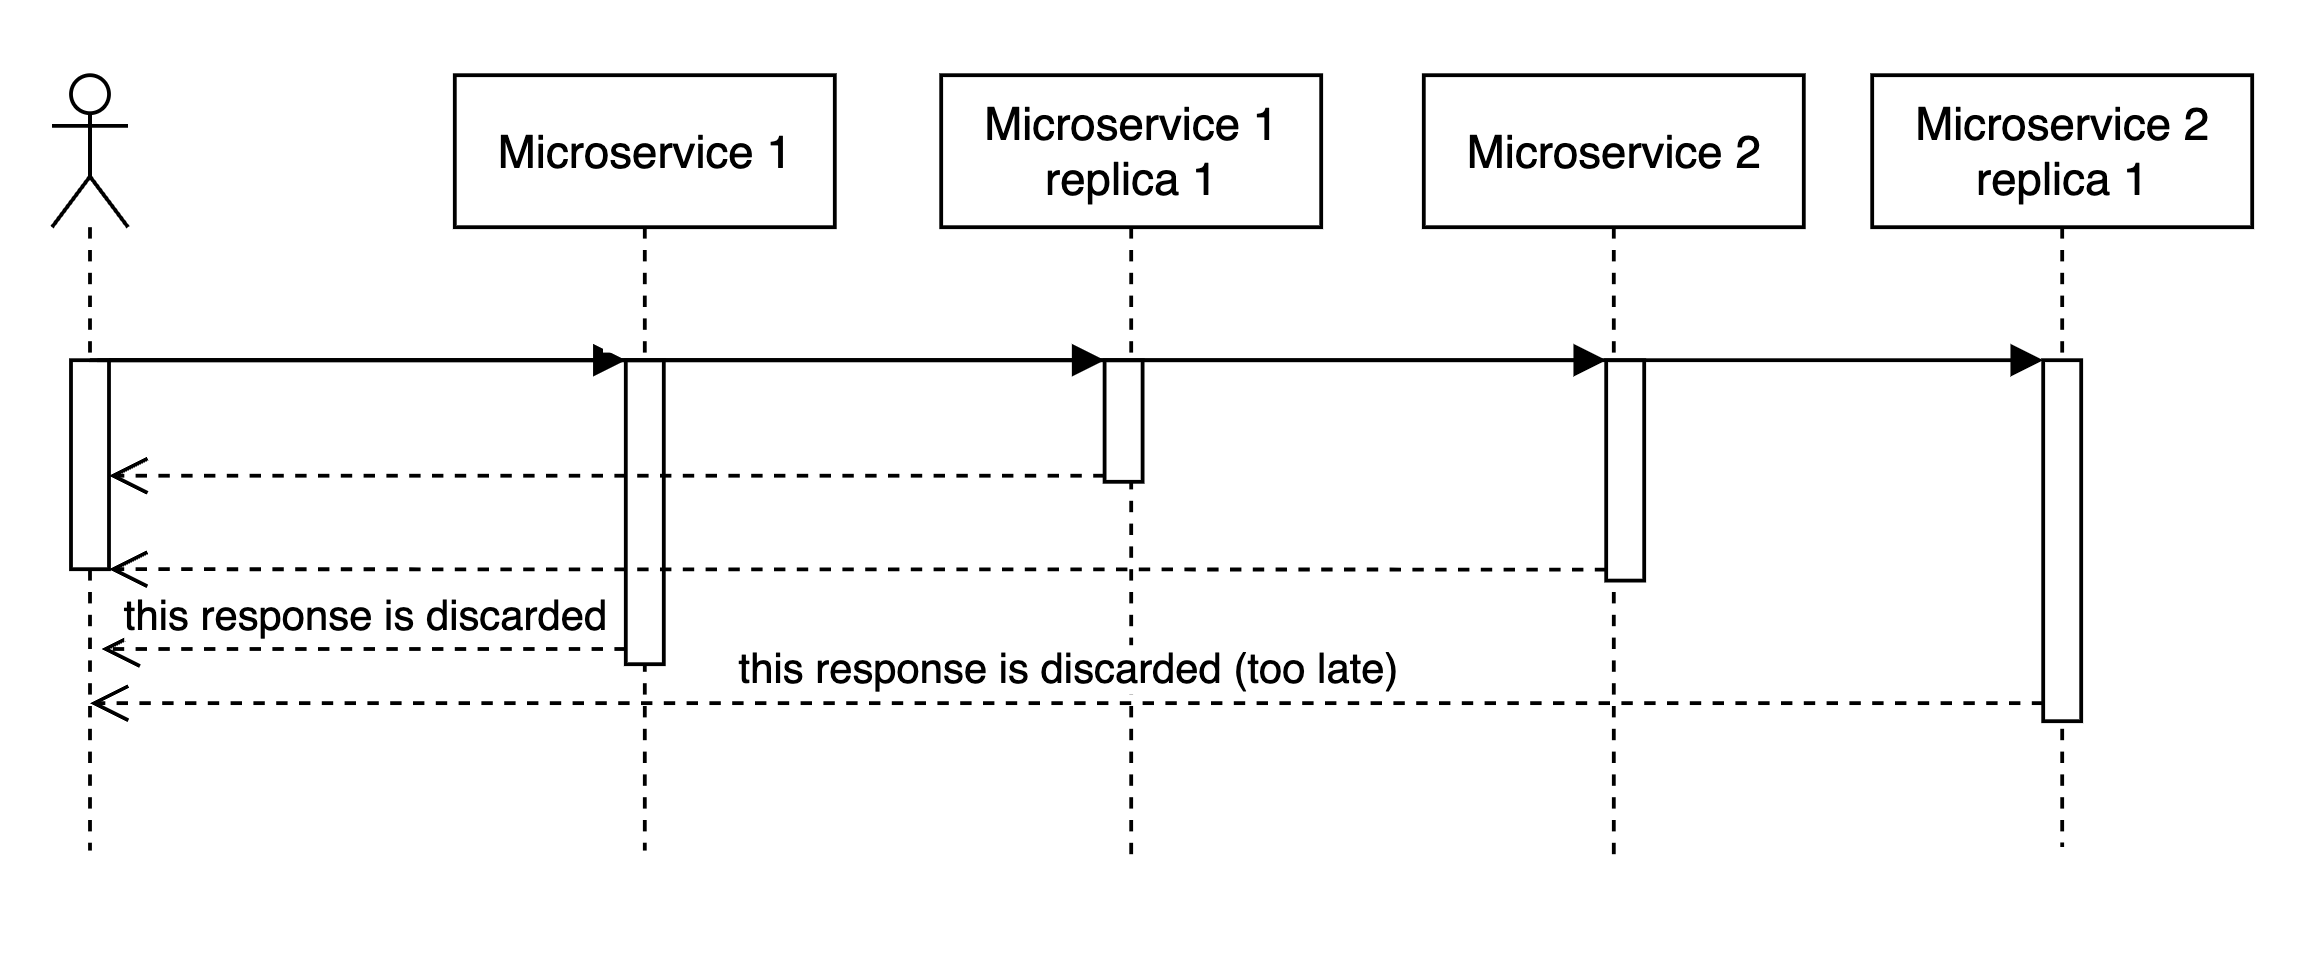
Yes, we can! If we can use multiple replicas, we can do parallel calls to all of them, and when we recieve the fastest answer, cancel all other in-flight requests, we would have a vey nice p99

Please also note, that we get the most results by having just a few (3) read replicas.
Improving sequential microservices access
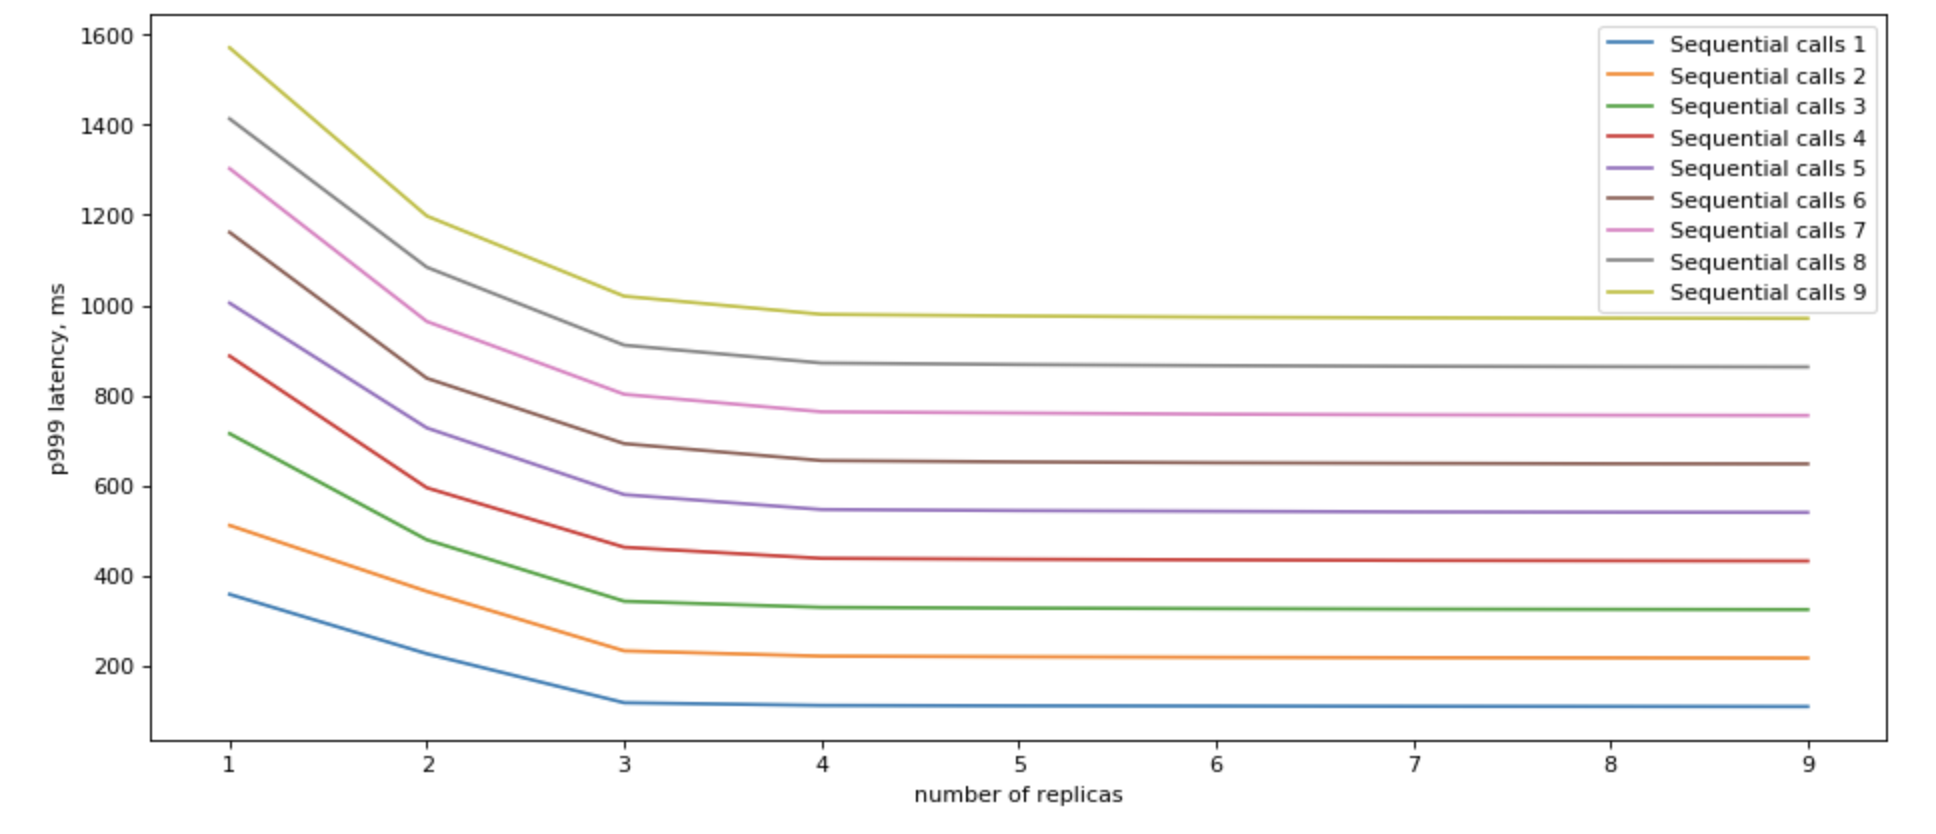
So for cases when we can’t change the sequetial matter of our code, we can add read replicas, and expect some imporovement, if we send requests to all read replicas in parallel, and as soon as we get first one (i.e. the fastest one), we go on.

In general, looks like for practical purposes and a single backend, it does quite well at 2 read replicas.
But it’s not great.

Improving parallel microservices access
If you call multiple read replicas in parallel, you would get a remarkable improvement in terms of latency.

There are a few points to consider:
- We are already fast with parallel calls. Do we need to be faster? Is it worth it?
- We likely have replicas for fault tolerance. Can we use them as read-only replicas?
- Network overhead. If you are close to network stack saturation on your nodes, does it make sense to double or triple the load?
