How do we measure latency
When we try to measure a latency to backend, including Redis, we would see a chart similar to this one:
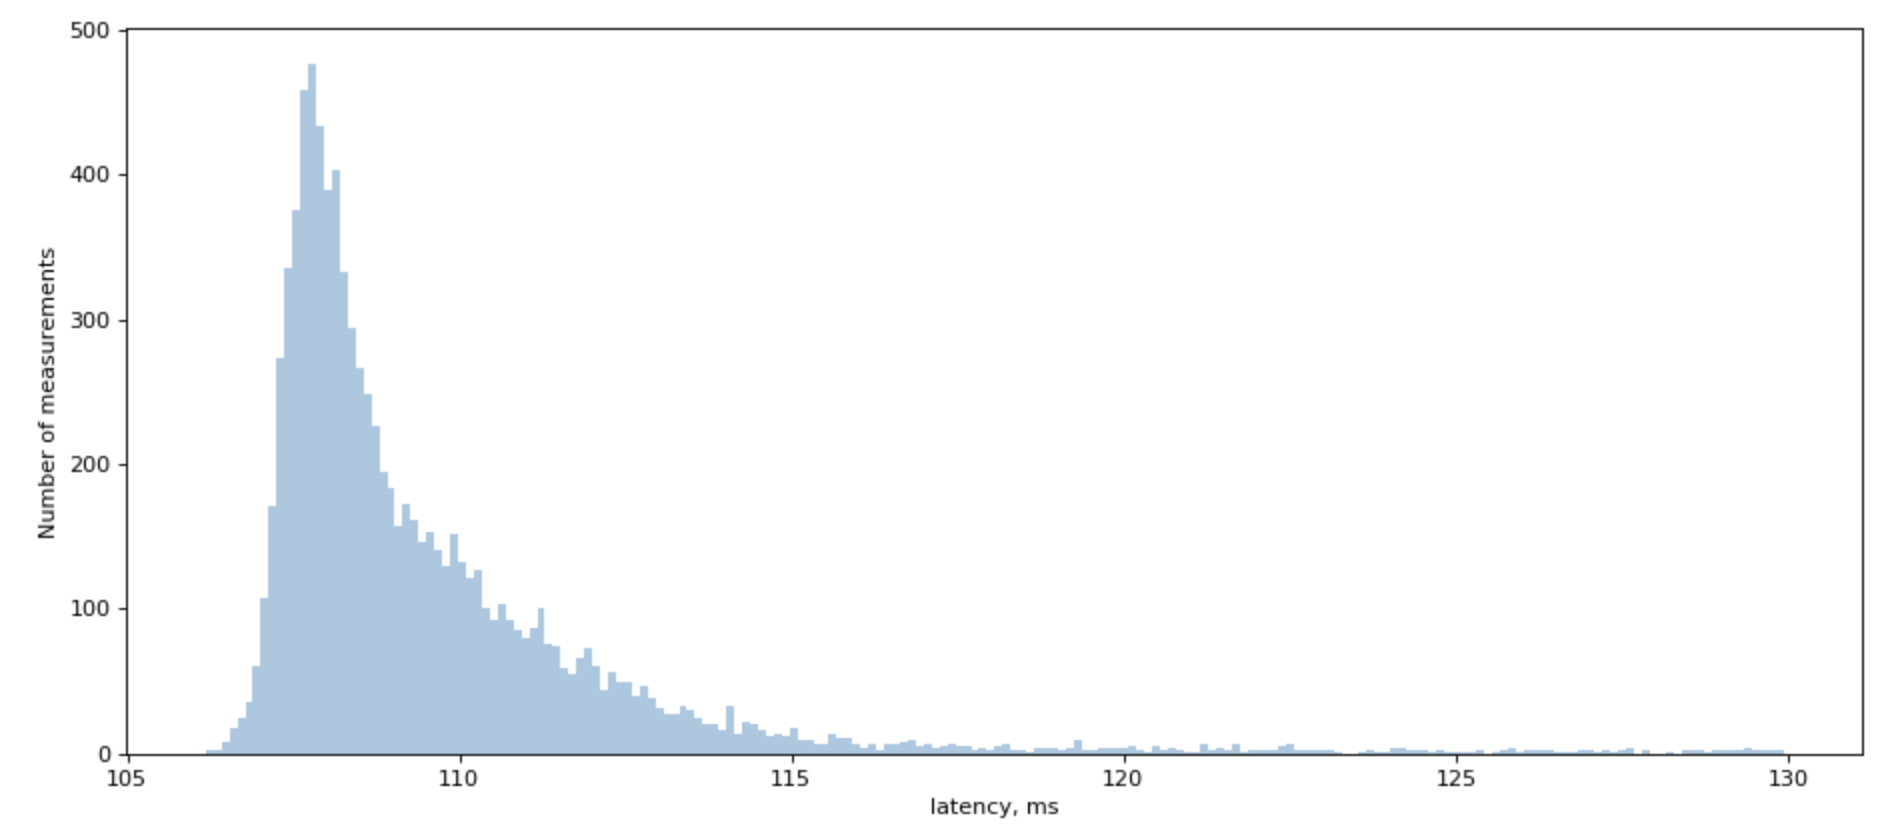
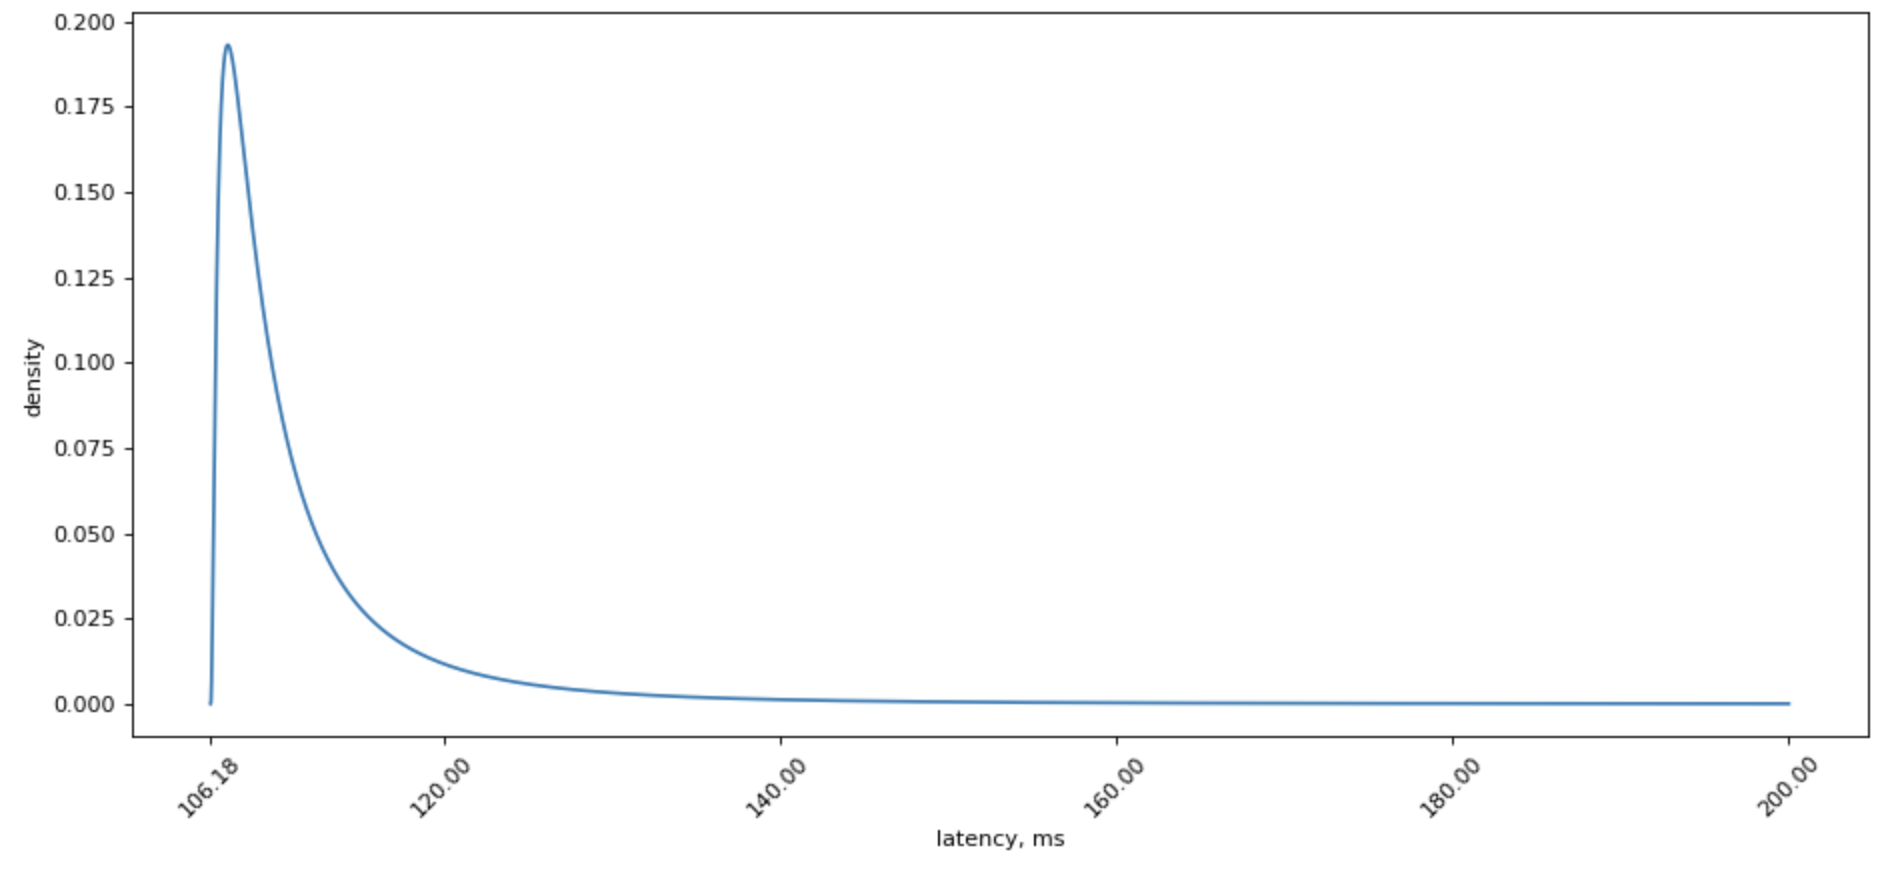
We often simplify things, saying that it’s a “lognormal” distribution, but if you try to fit lognoram distribution, you will find that real-world distribution has a very unplesant tail that doesn’t really want to be fitted.
However, lognormal distribution is sure much prettier to look at:
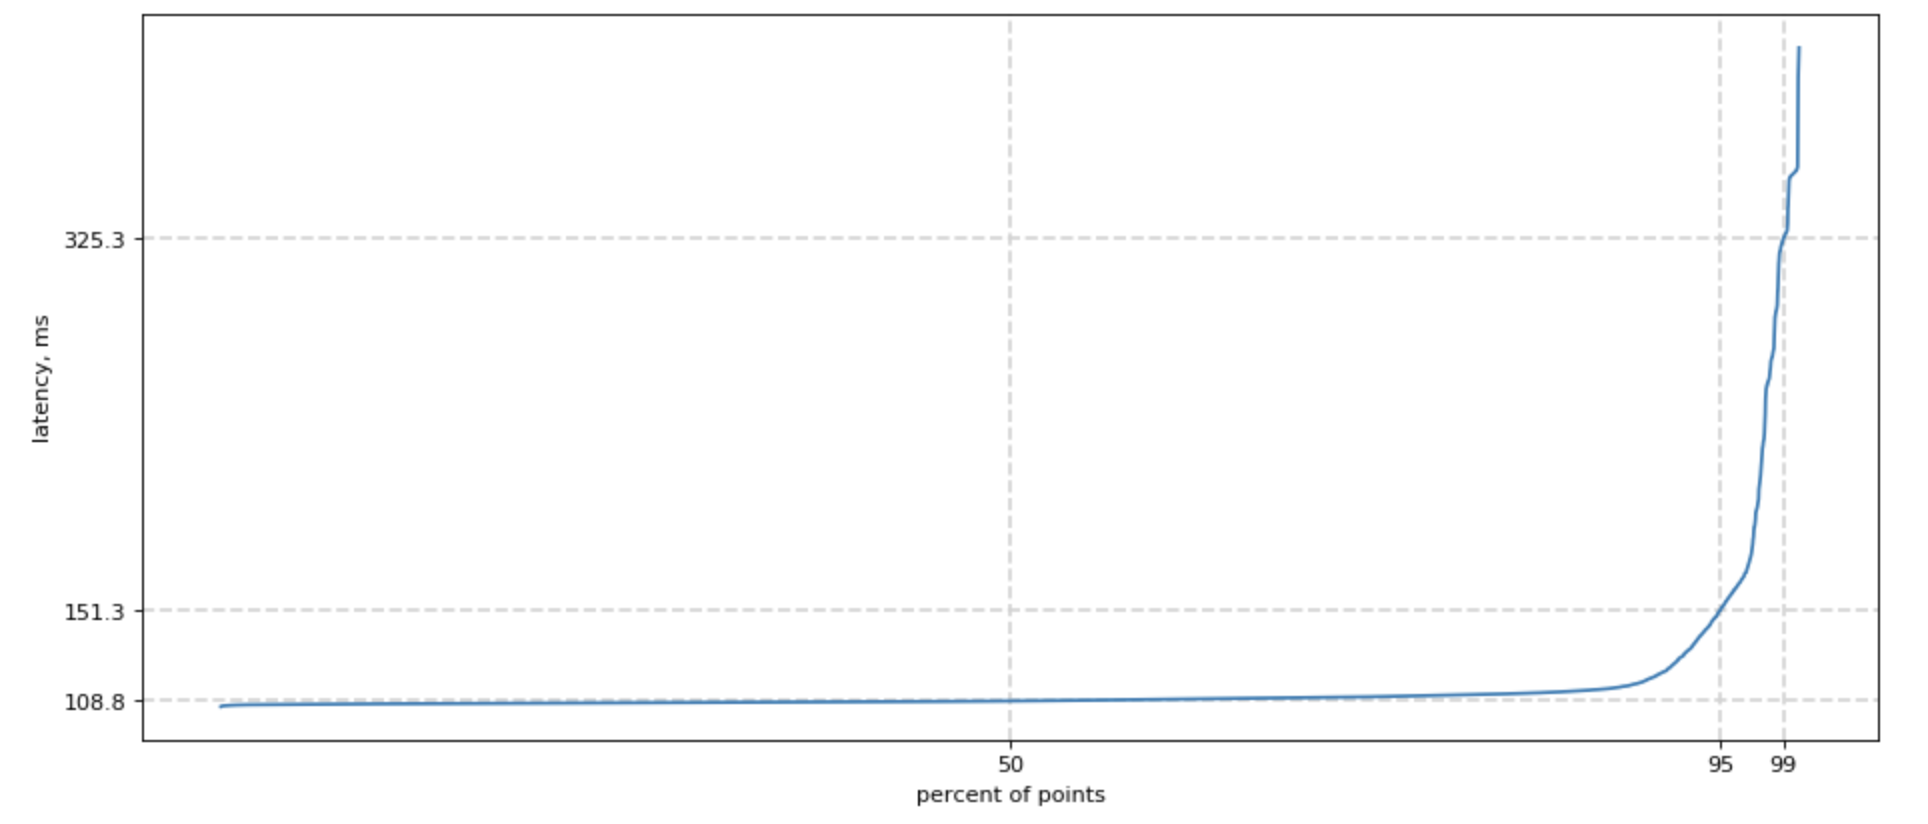
Since we started speaking of tails, how do we measure one?
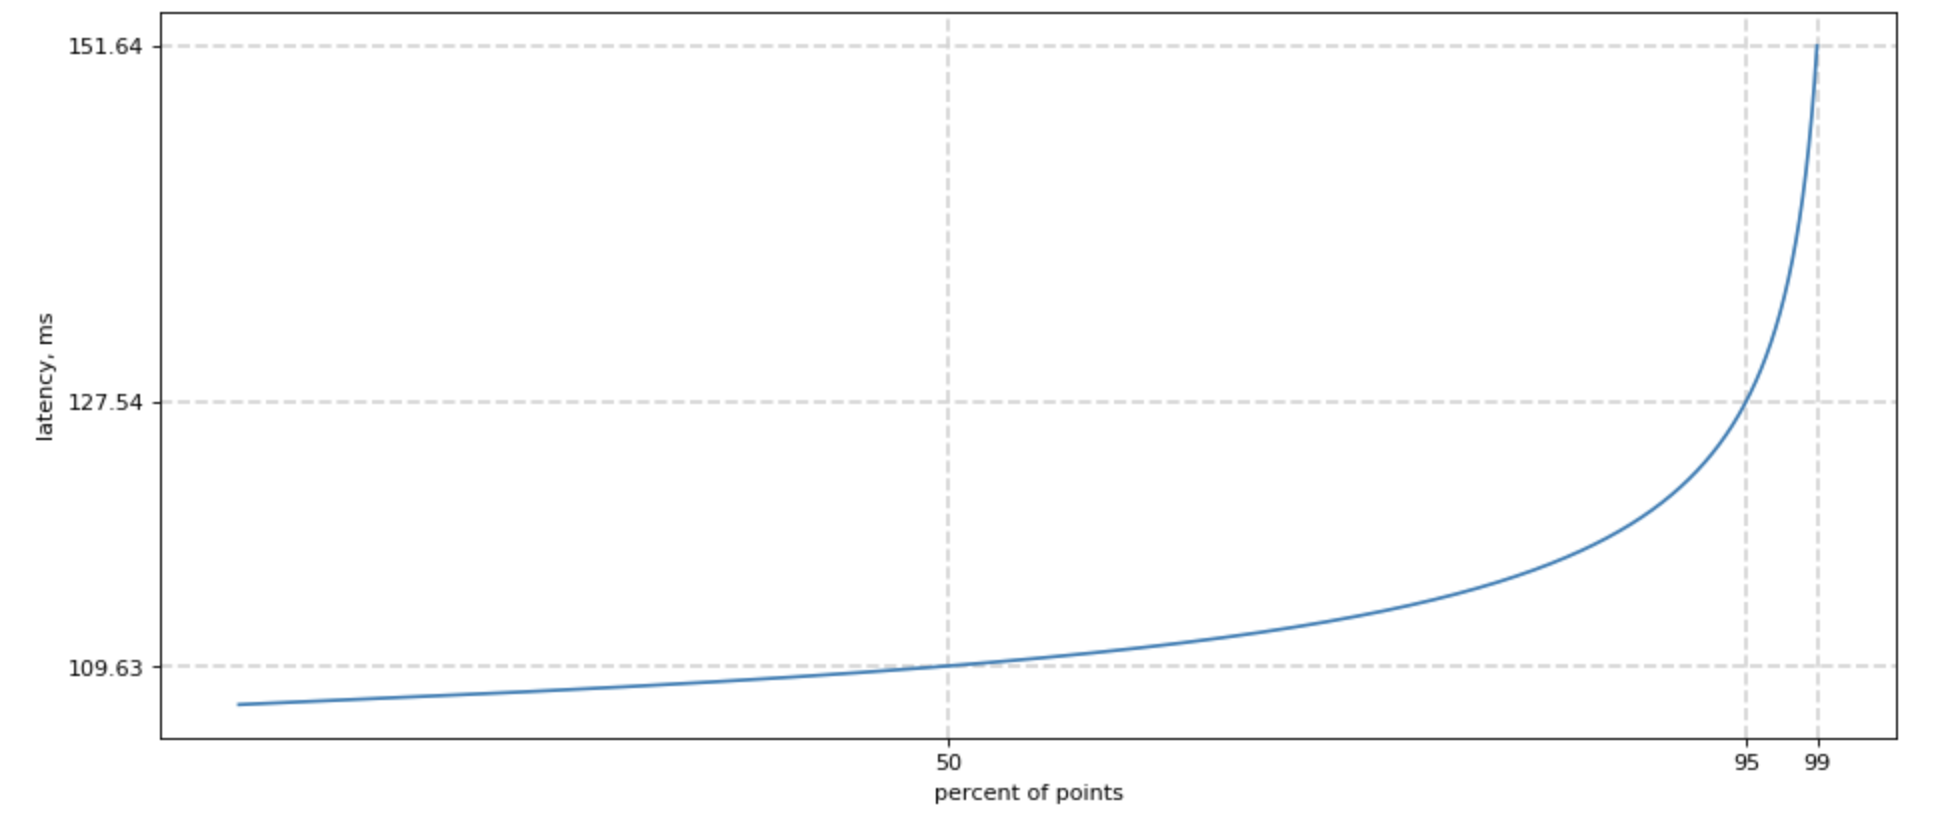
Easy! We can sort all our measurements, count 50% lowest latencies, and ask what is the highest latency for this group? We would also want this number of 50, 95, and 99 percentile, and sometimes 99.9. For shortness, we call it p50, p95, p99.
Poorly fitted, but much prettier chart for lognormal distribution looks like this:
Overall p99 latency
When you show p99 over time for different backends it would most likely look something like this, if the servers have different loads:
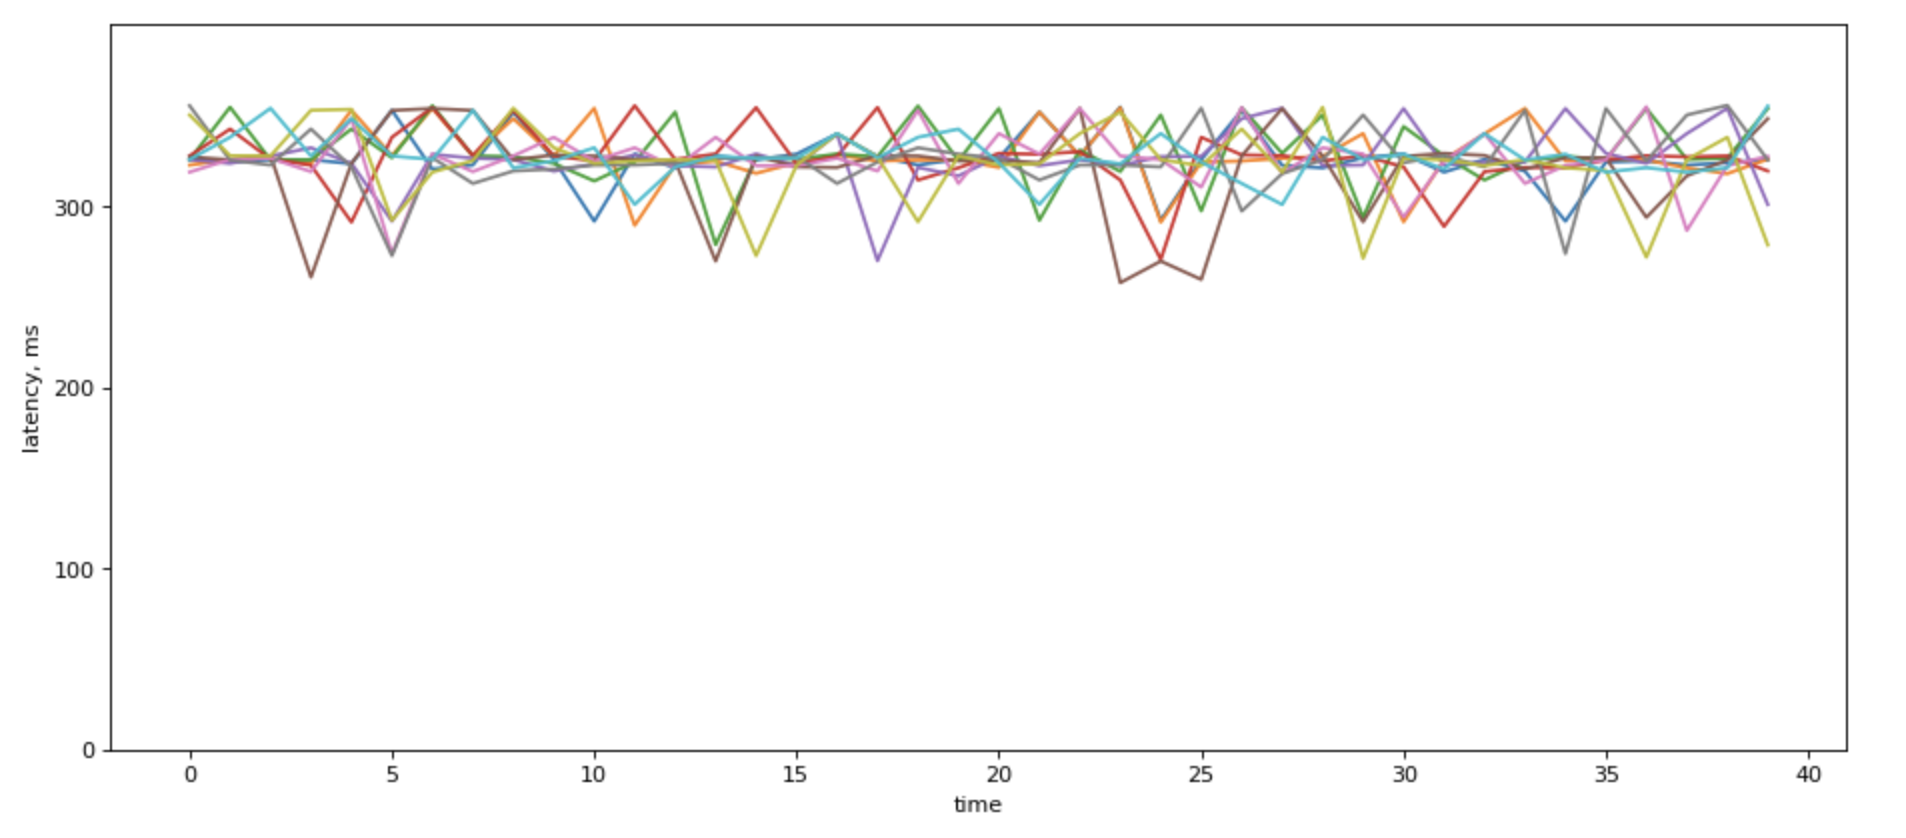
When there are a lot of lines in there, fight the urge to average over p99. It sure looks prettie:
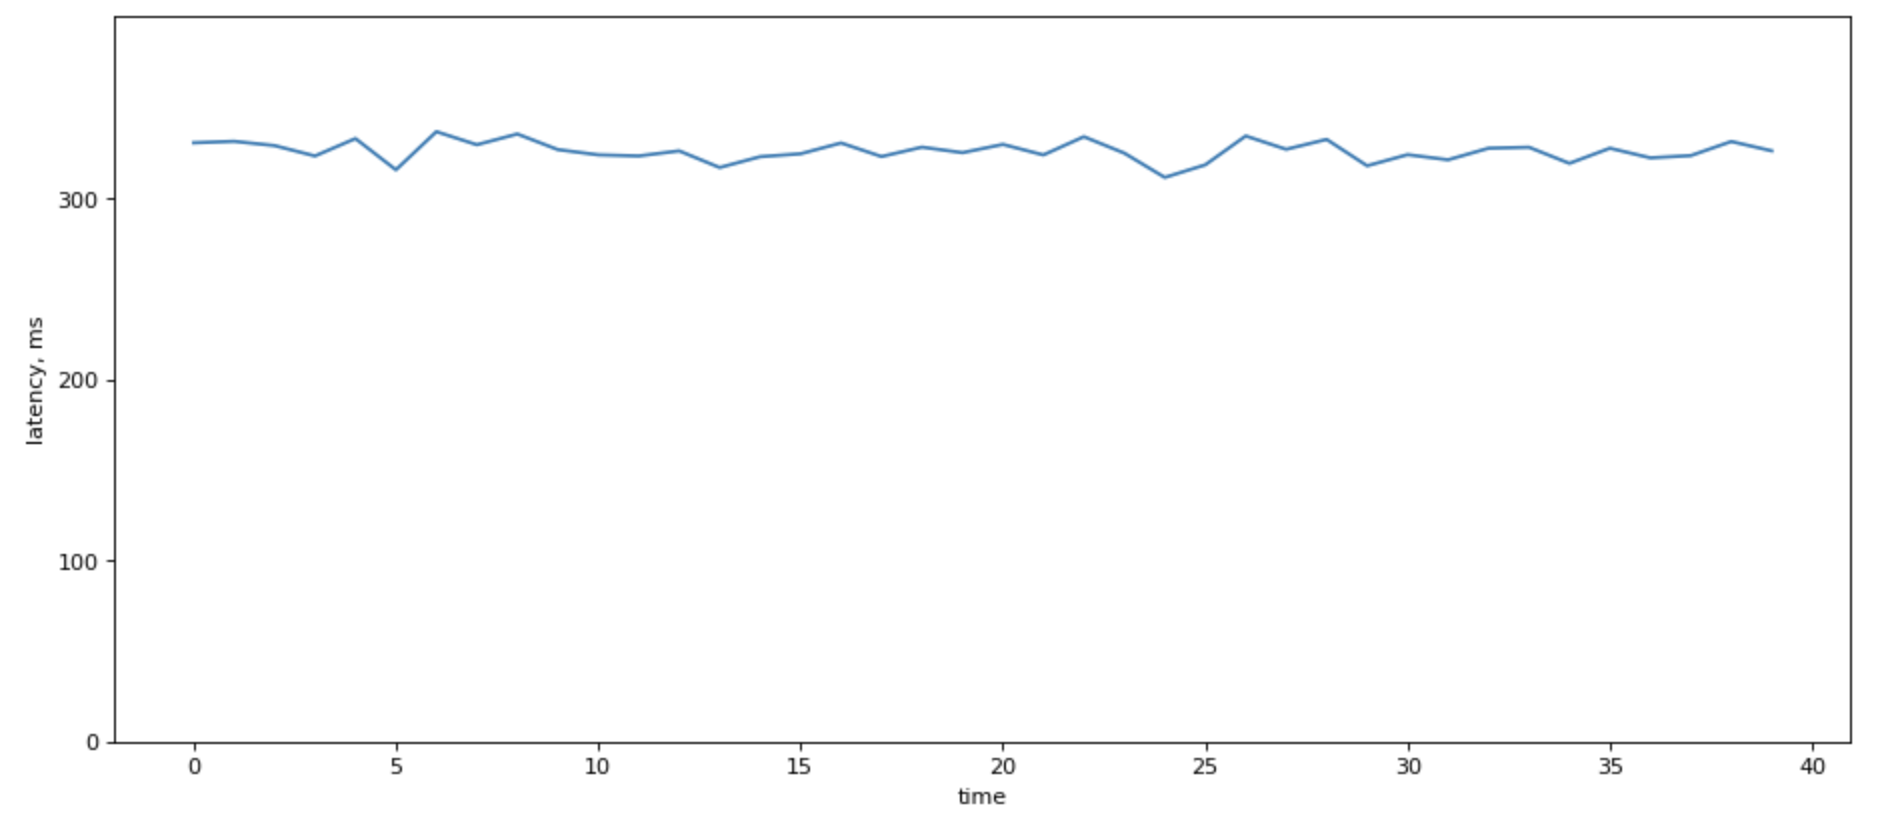
Howeer, it destroys information about load balancing among your servers.
One of the “right ways” to calculate system’s p99 latency is by using a sample of latencies across the system. But this can be burdensome.
May be the way is not to calculate it at all.
A good reason not to use average is to think about a couple of situations where averaging will give a very wrong results:
High p99 in part of the system
| Node | Latency | RPS |
|---|---|---|
| Node 1 | 100 ms | 1000 |
| Node 2 | 200 ms | 1000 |
If you sort their latencies, most likely, second node’s latencies would be so far to right compared to the first one, and the overall latency would be dominated by the second node. So the “true” p99 would be 200ms, but the average is just 150ms. Not great.
Unbalanced load
A second case, if you have unbalanced load profile, where one (some) of your nodes handle a higher load. That easily can happen in heterogeneous system with baremetal servers.
Consider two nodes from our distribution
| Node | Latency | RPS |
|---|---|---|
| Node 1 | 151 ms | 1000 |
| Node 2 | 78 ms | 10000 |
The average of that is (151+78)/2 = 114.5. But in reality, that can be just 80 ms, because Node 1 with high RPS would “dominate” the distriubiton.